Suavização
Bibliotecas
Suavização
(locally estimated scatterplot smoothing/Local Polynomial Regression Fitting)
gap_07 <- filter(gapminder, year == 2007)
ggplot(gap_07, aes(x = gdpPercap, y = lifeExp)) +
  geom_point() +
  geom_smooth()
#> `geom_smooth()` using method = 'loess' and formula = 'y ~ x'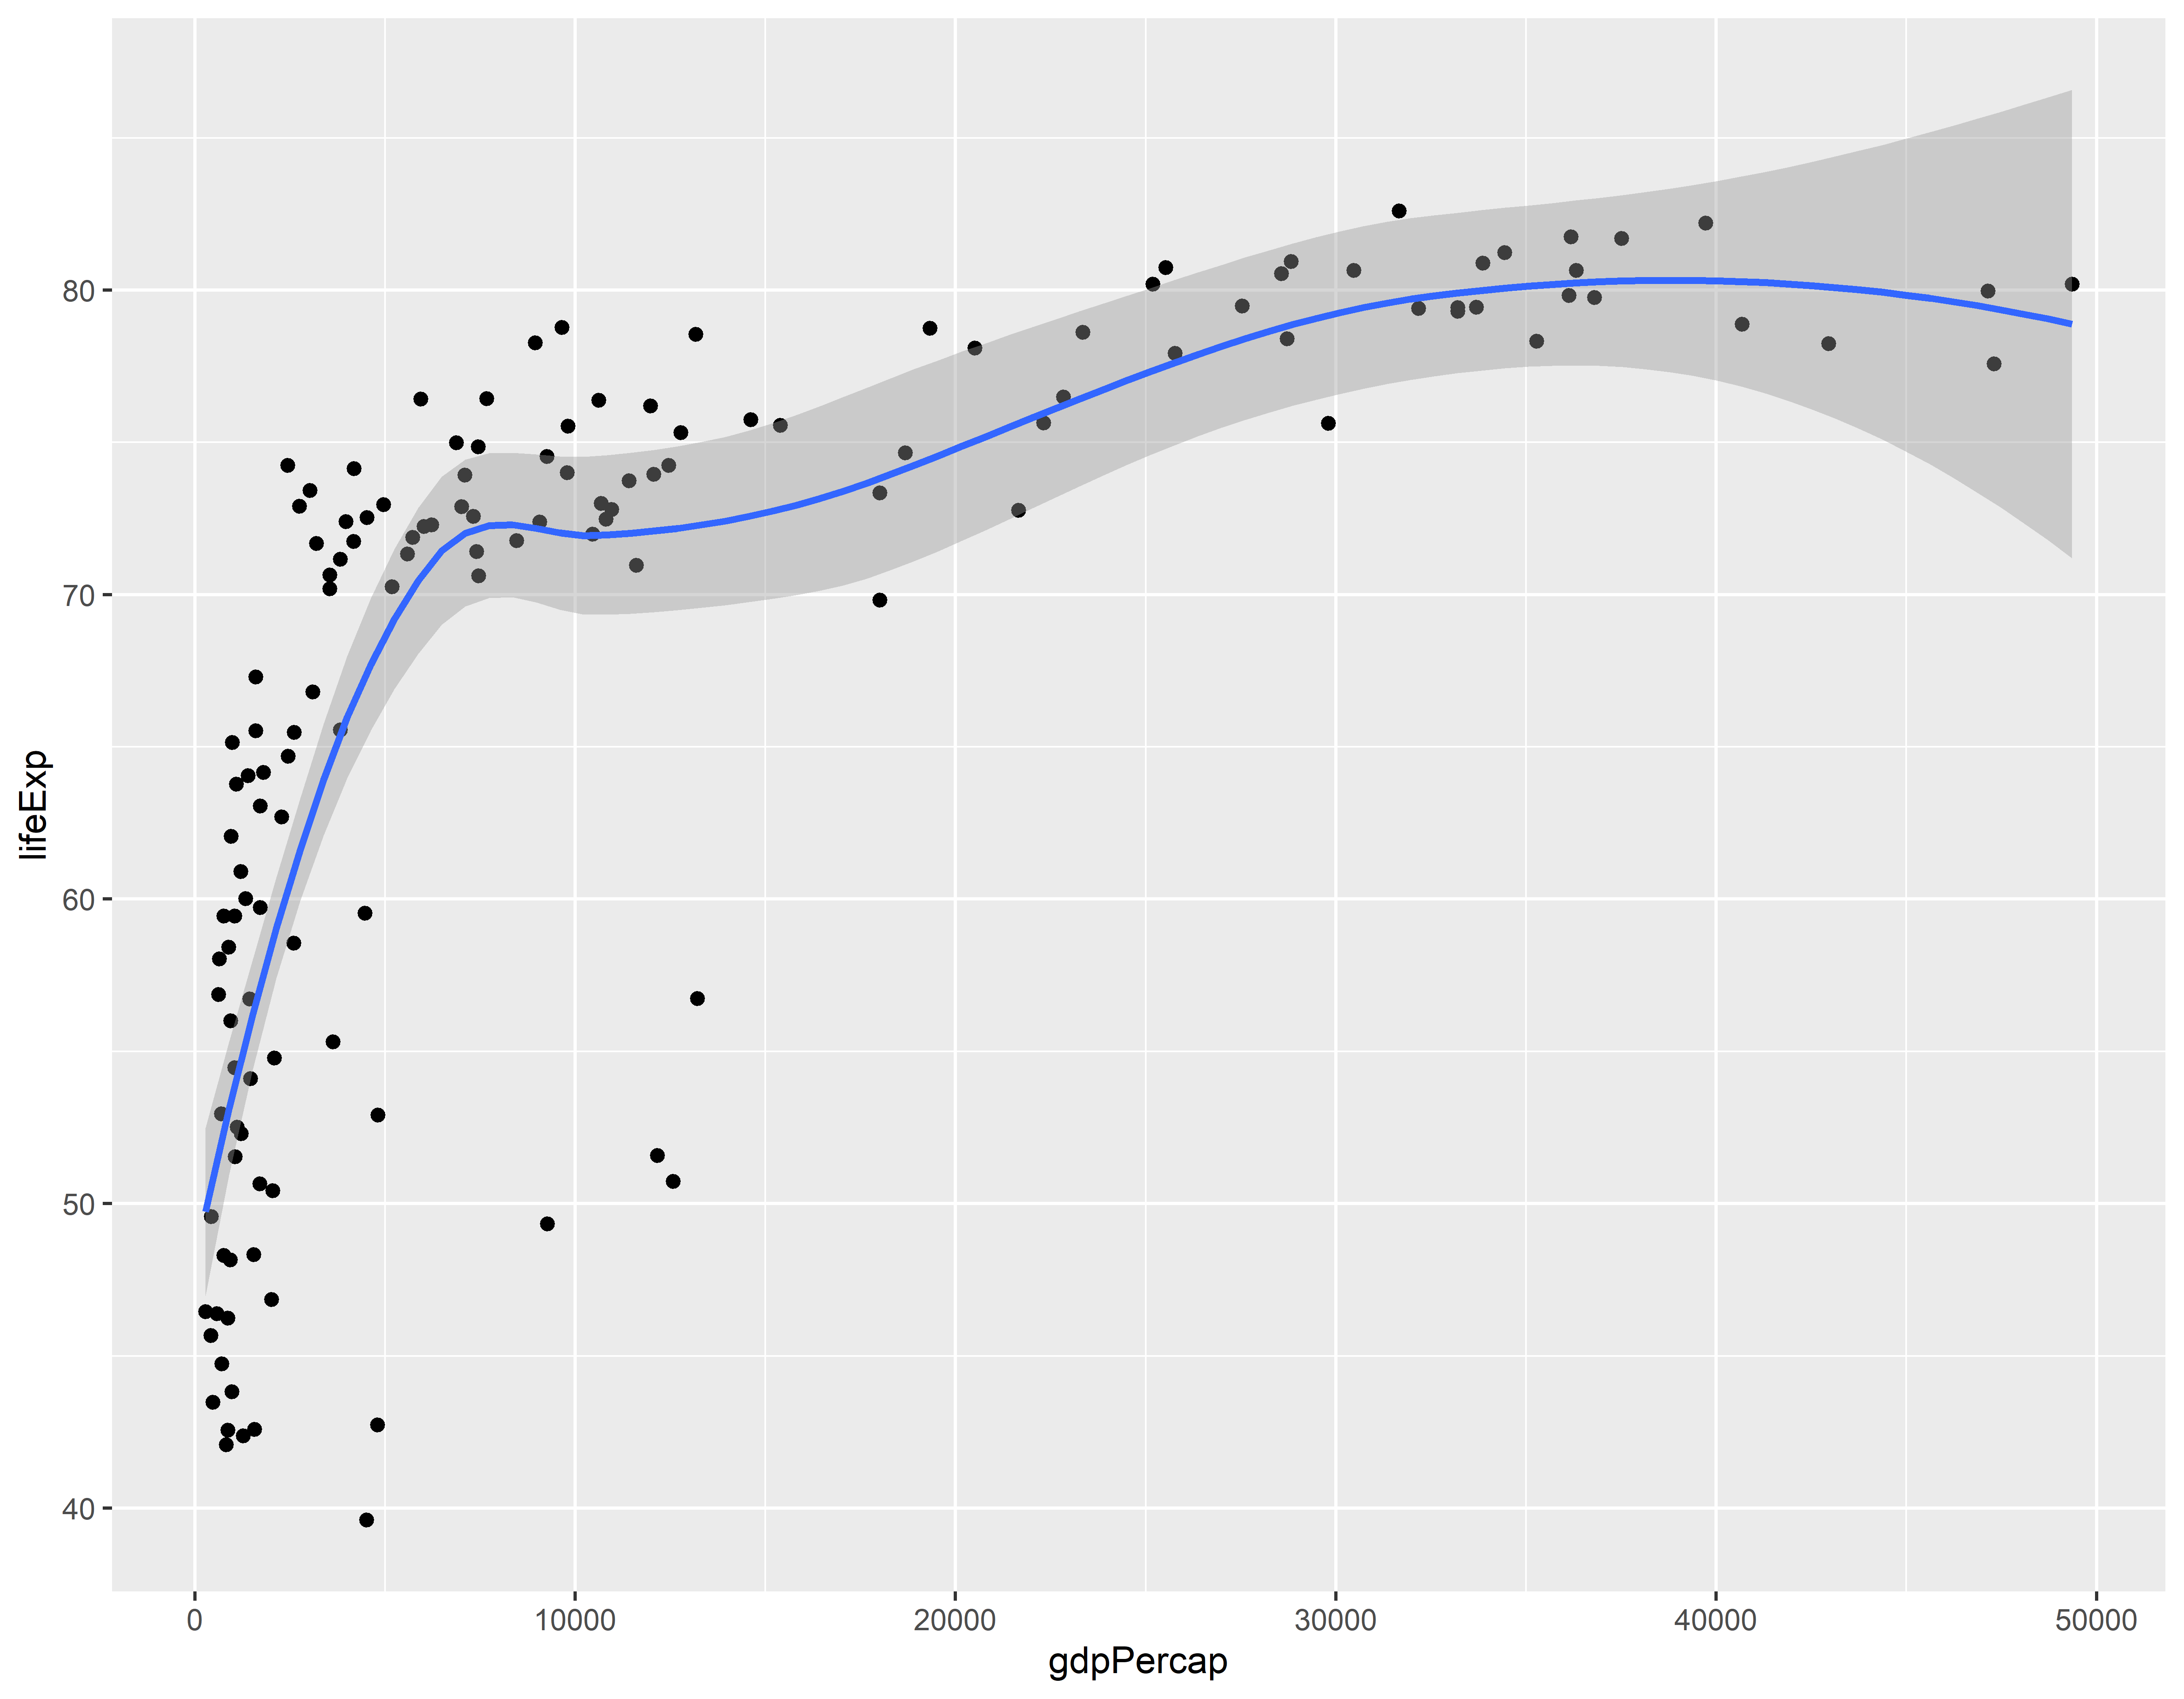
Fazendo o suavizador mais nervoso
ggplot(gap_07, aes(x = gdpPercap, y = lifeExp)) +
  geom_point() +
  geom_smooth(span = 0.2) +
  theme_minimal()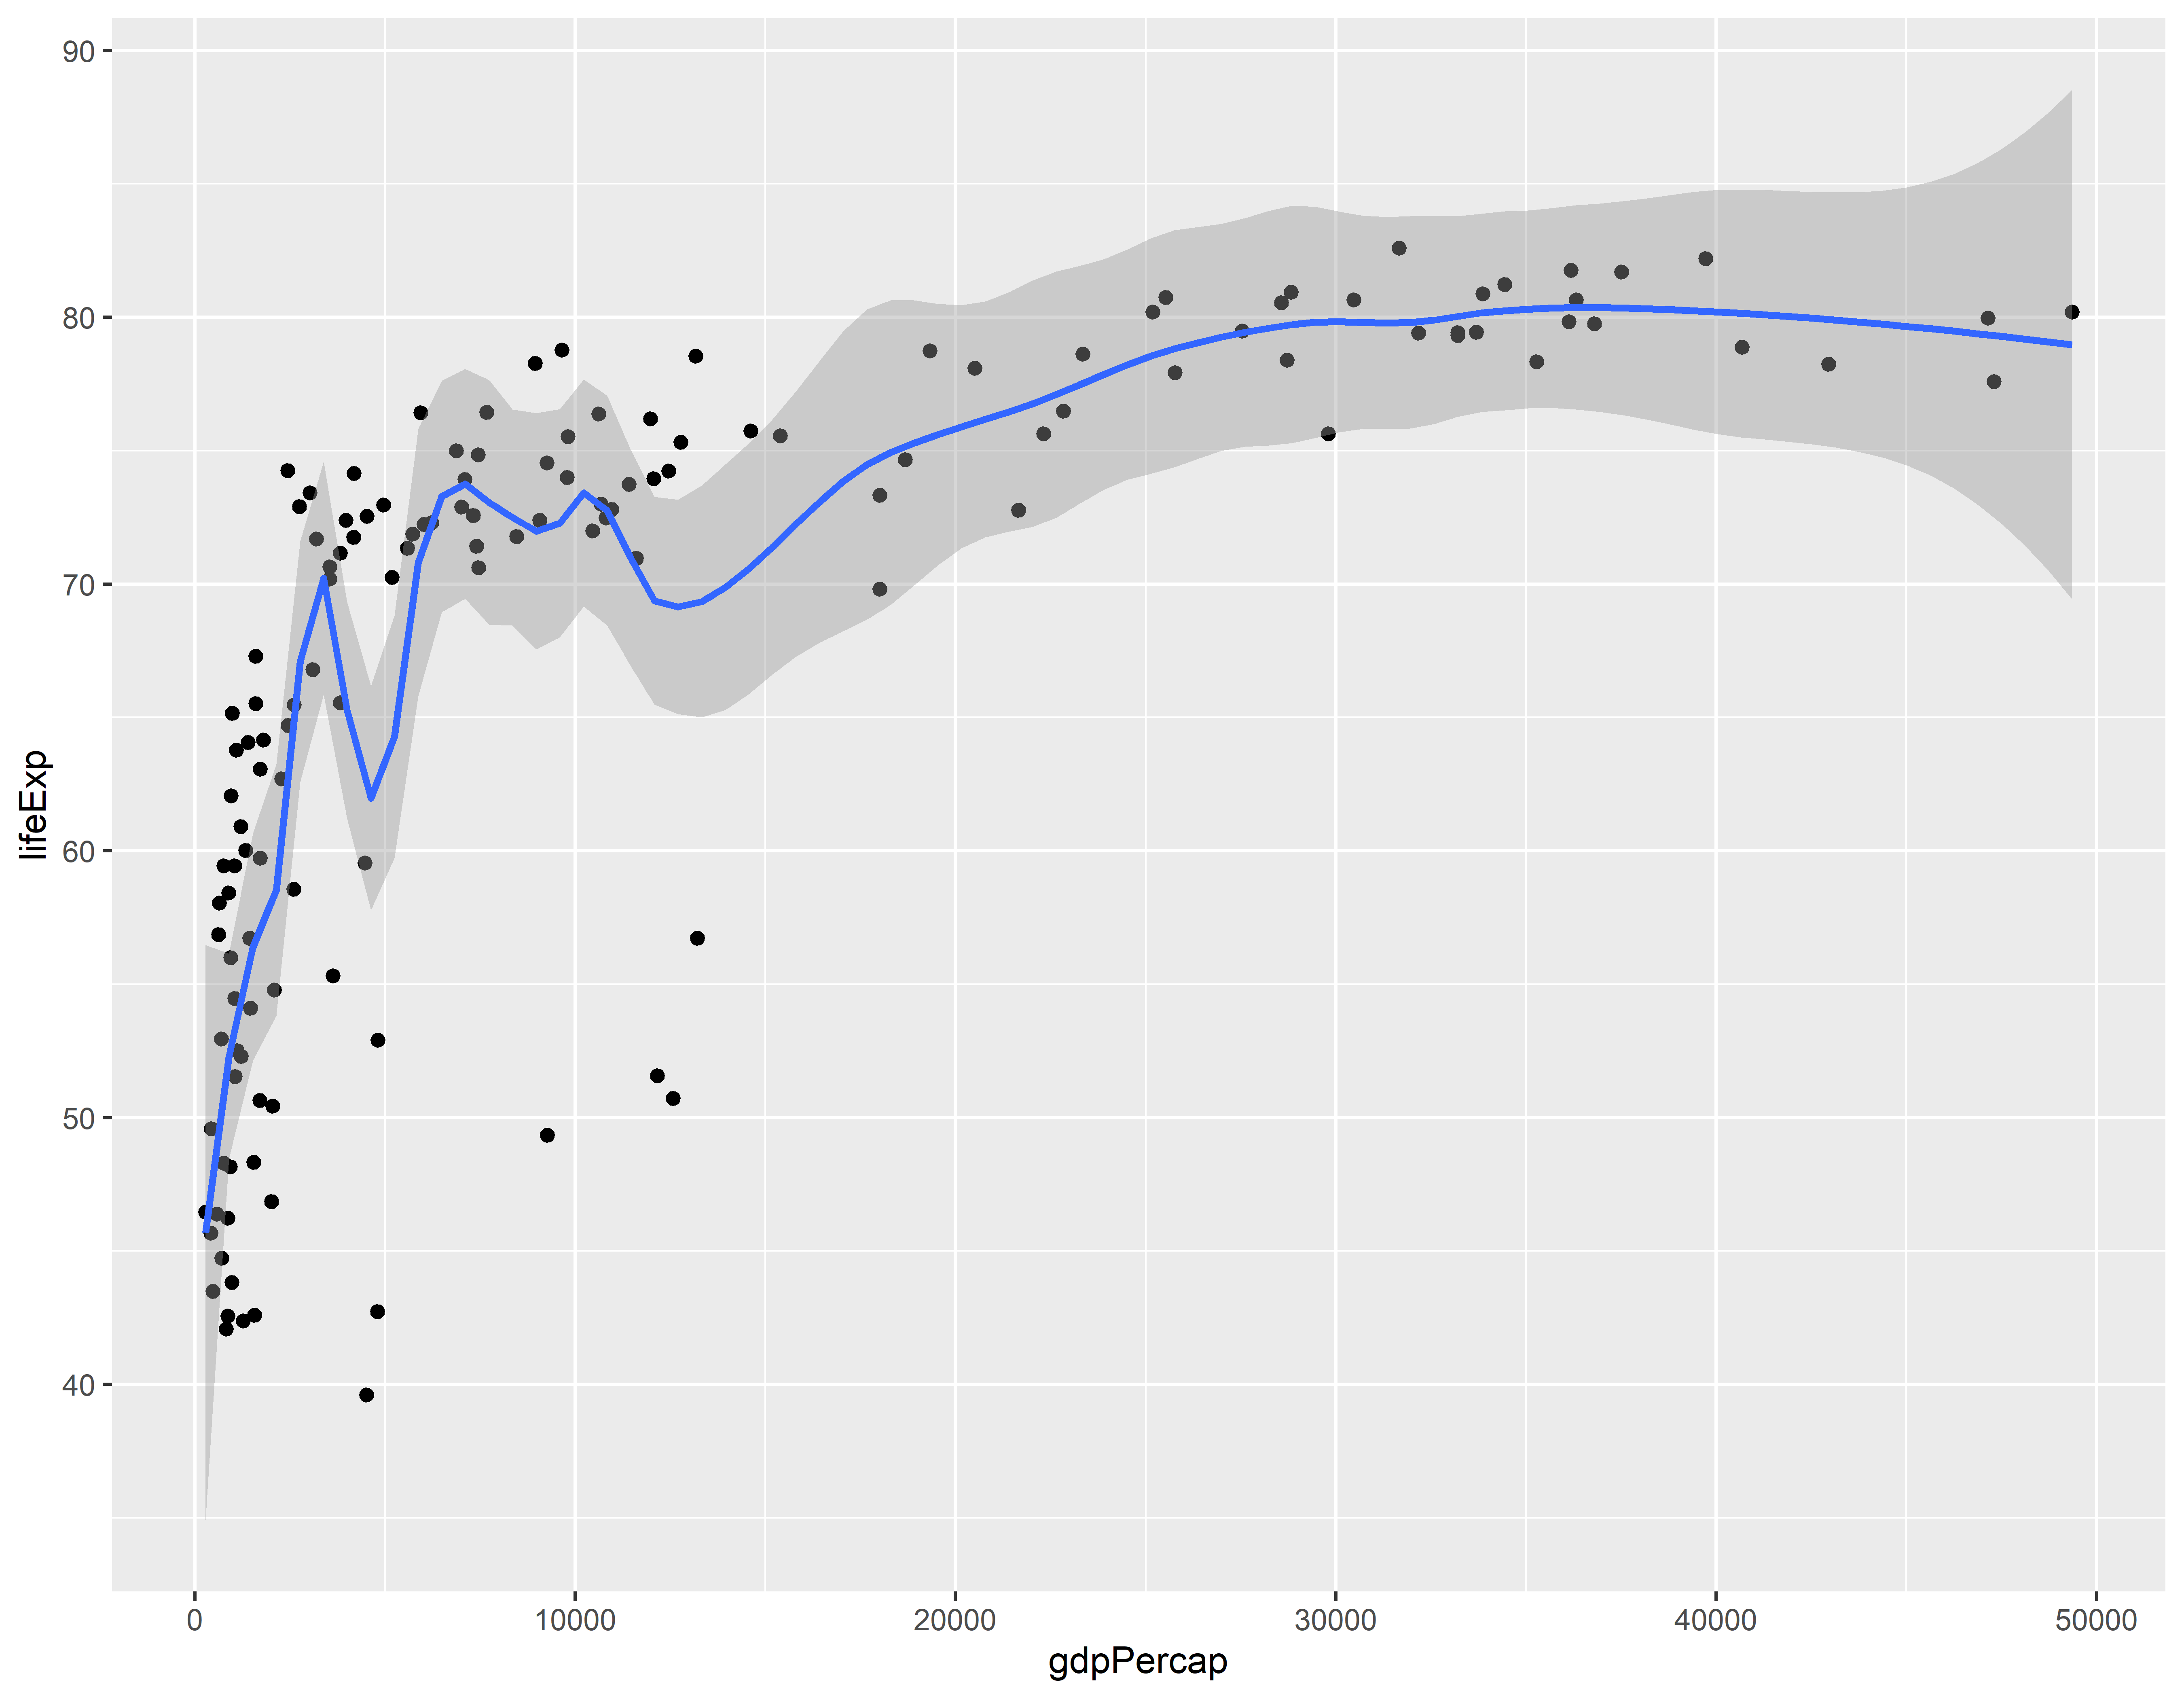
Fazendo o suavizador menos nervoso
ggplot(gap_07, aes(x = gdpPercap, y = lifeExp)) +
  geom_point() +
  geom_smooth(span = 0.9)  +
  theme_minimal()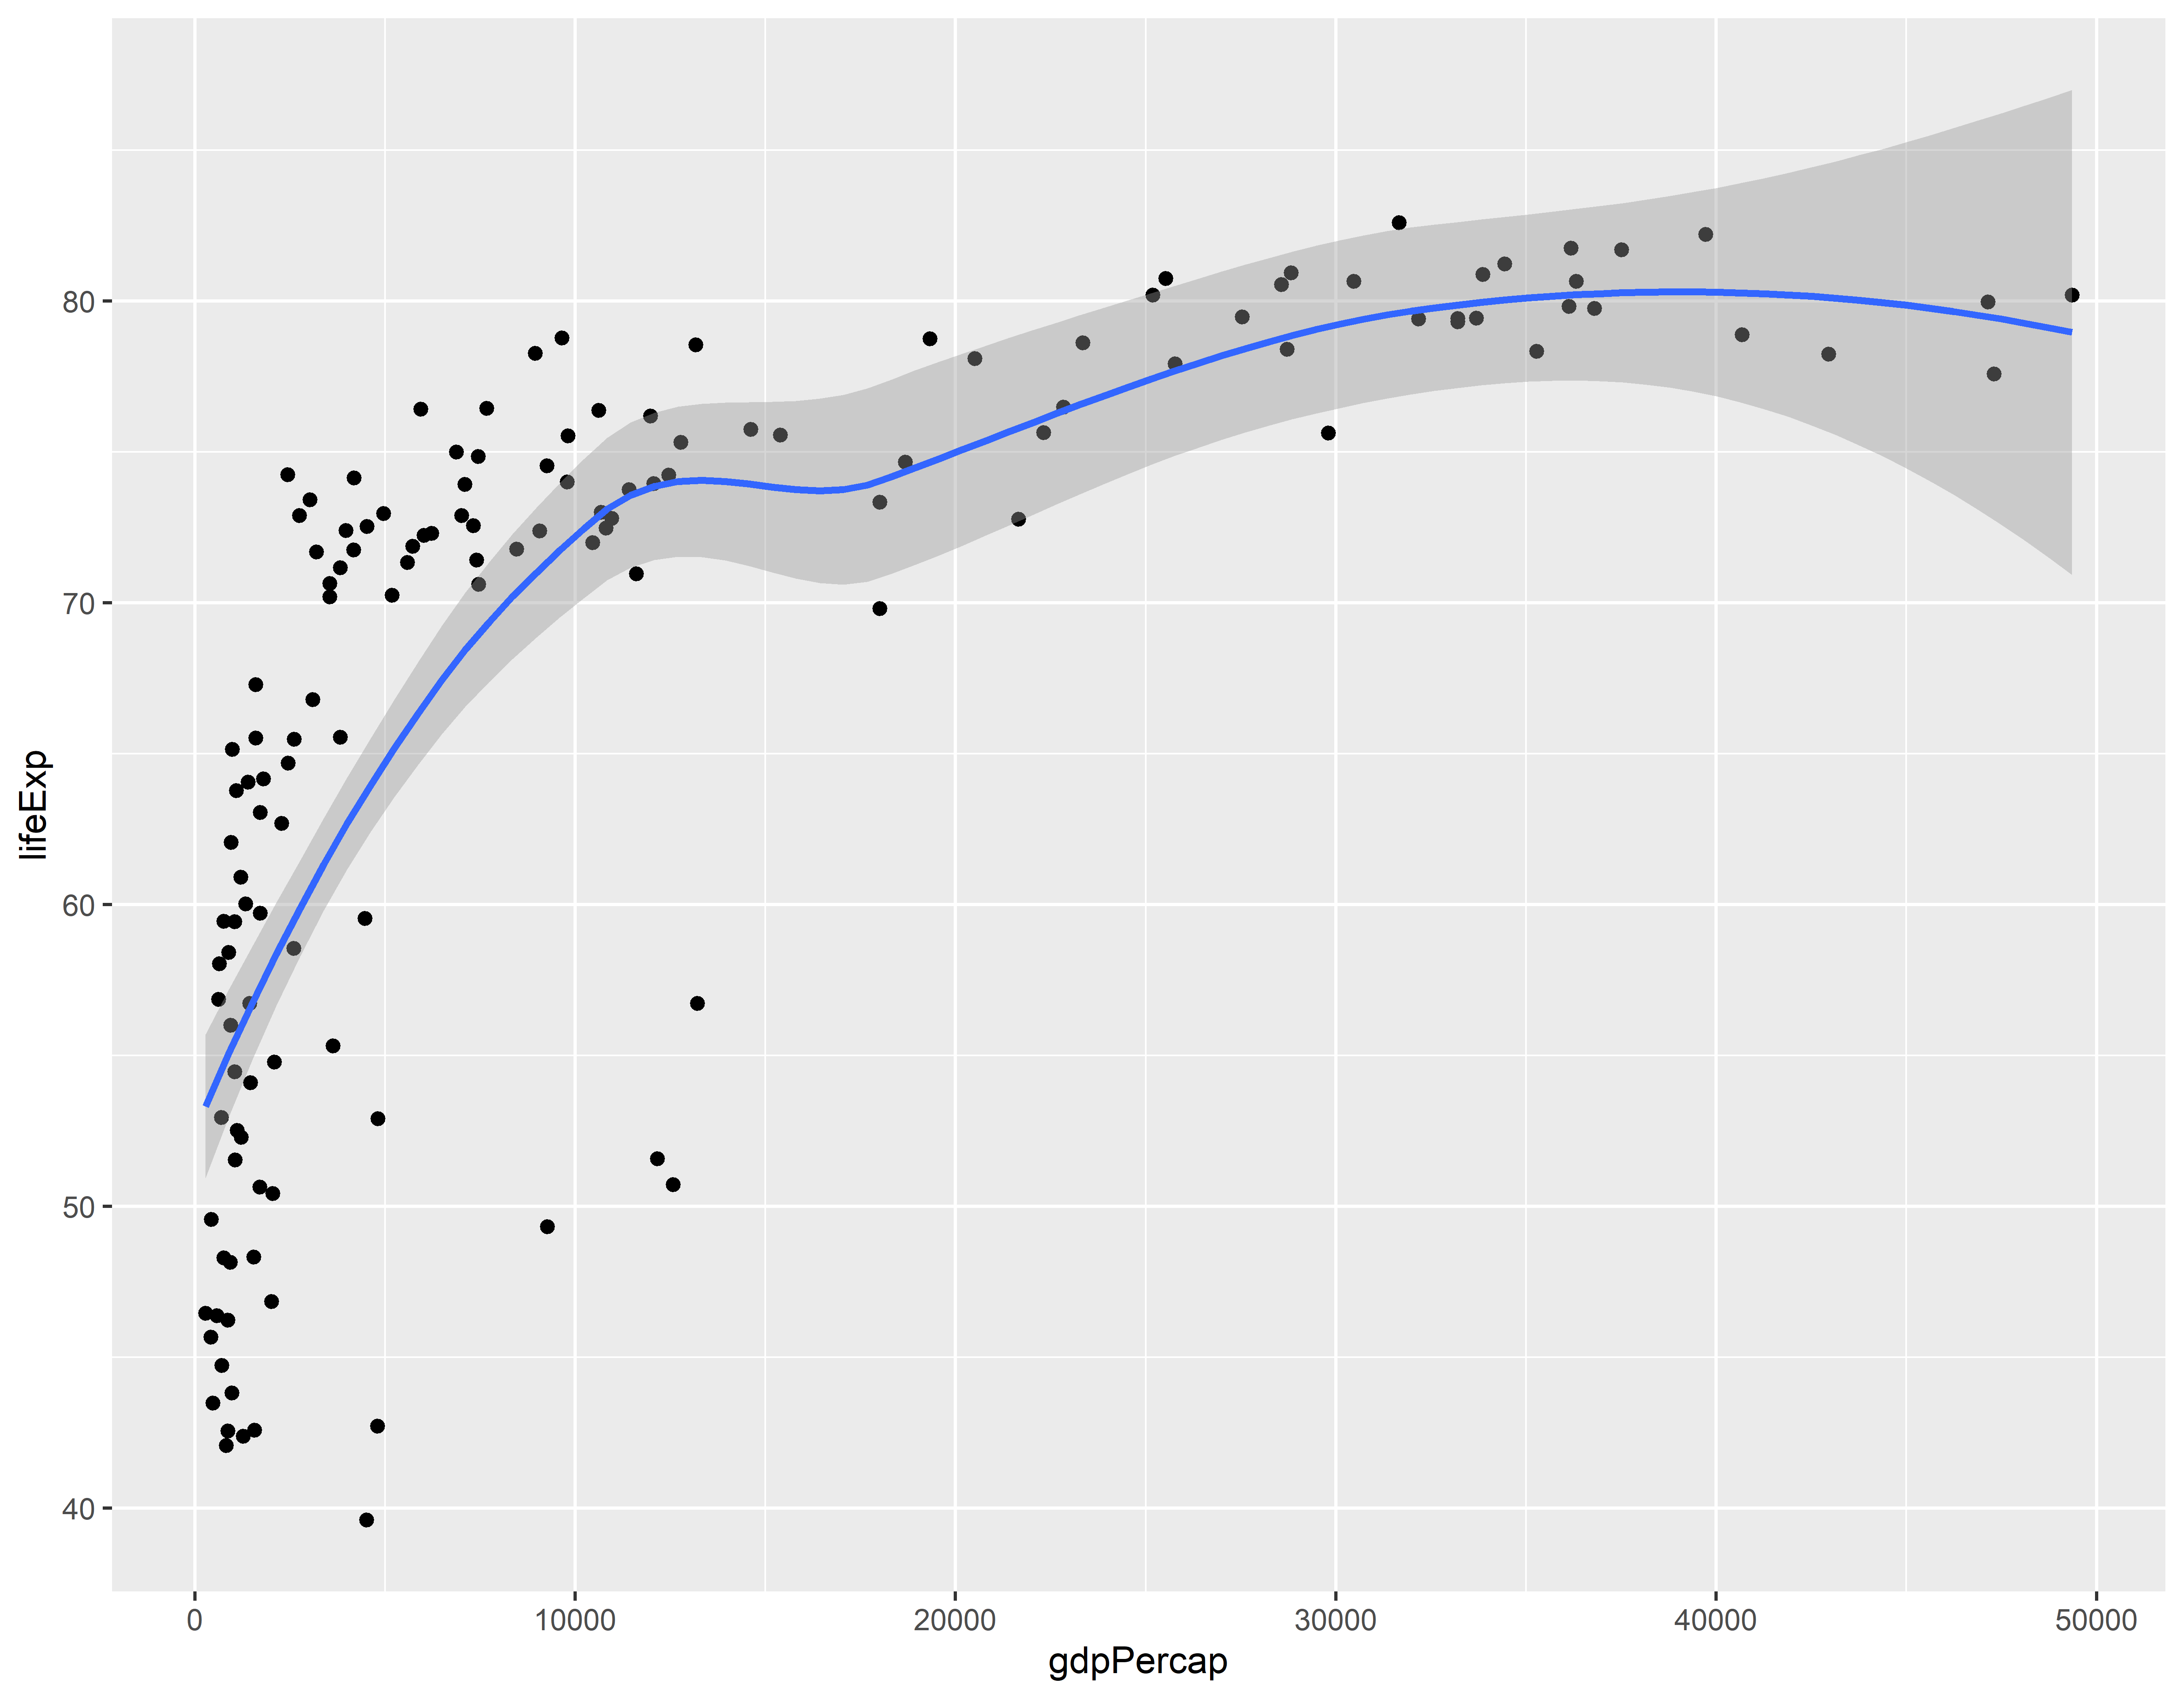
Removendo intervalos de confiança
ggplot(gap_07, aes(x = gdpPercap, y = lifeExp)) +
  geom_point() +
  geom_smooth(se = FALSE)  +
  theme_minimal()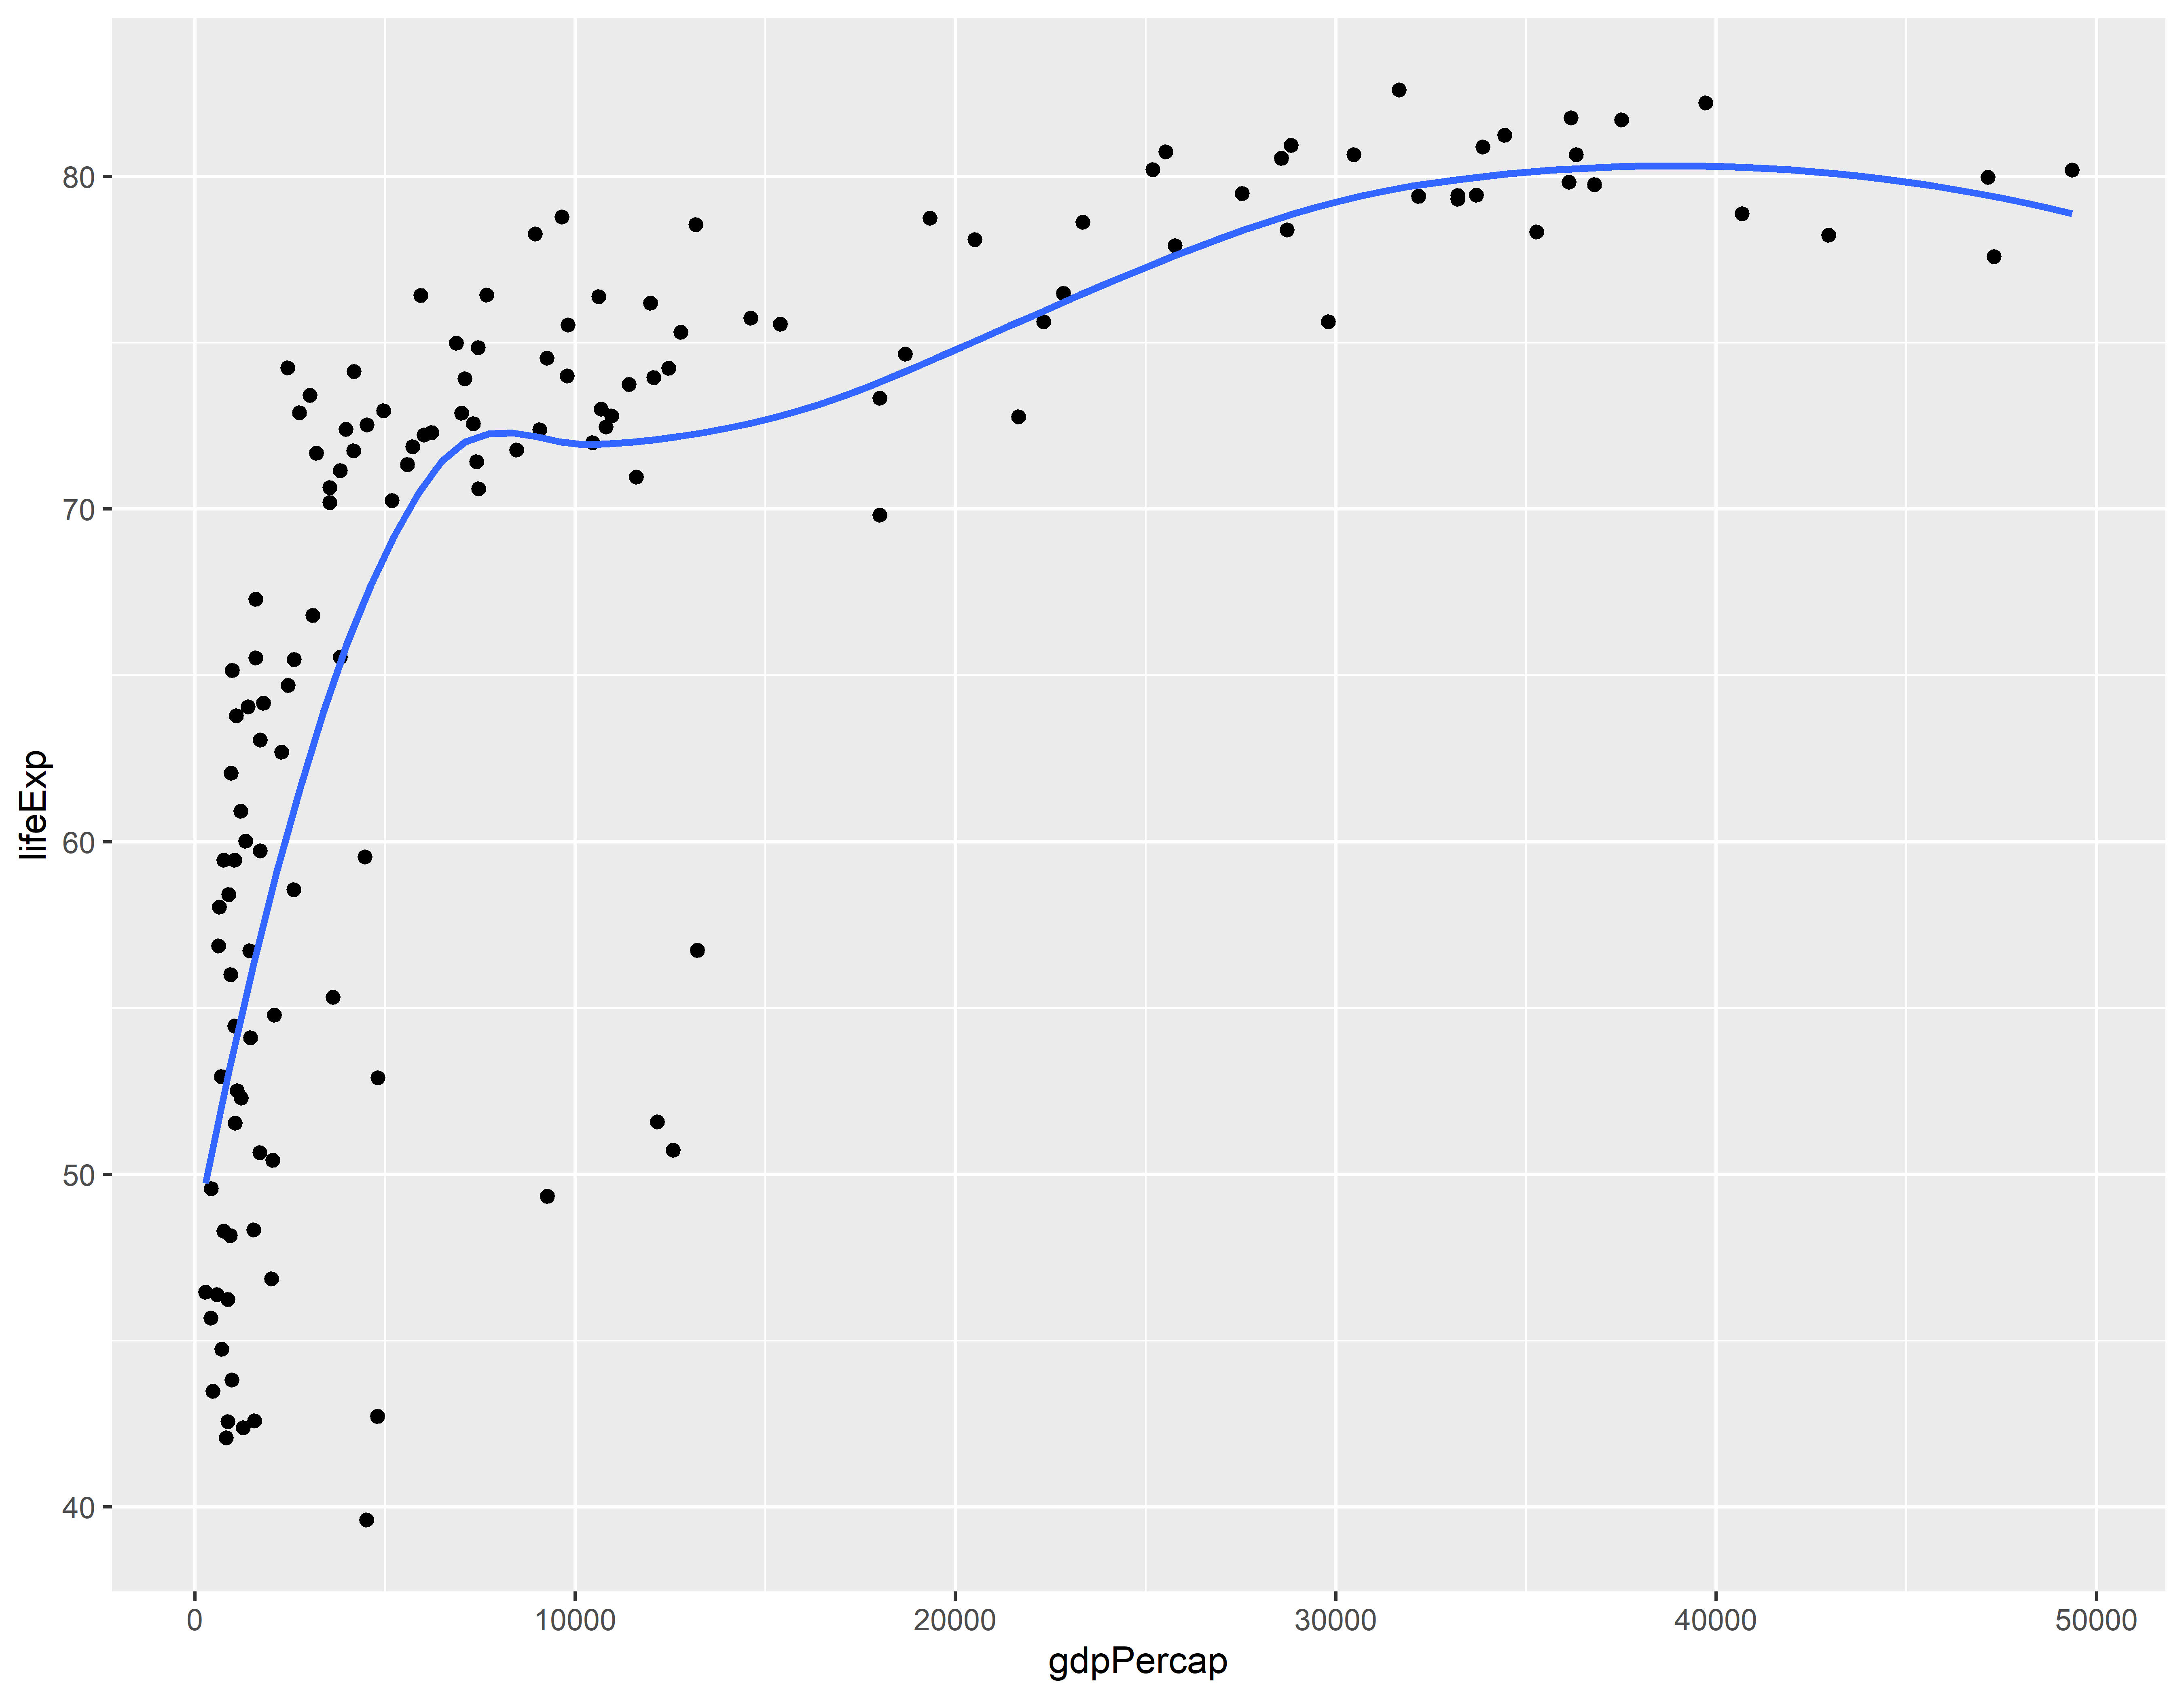
Usando IC de 90%
ggplot(gap_07, aes(x = gdpPercap, y = lifeExp)) +
  geom_point() +
  geom_smooth(level = 0.90) +
  theme_minimal()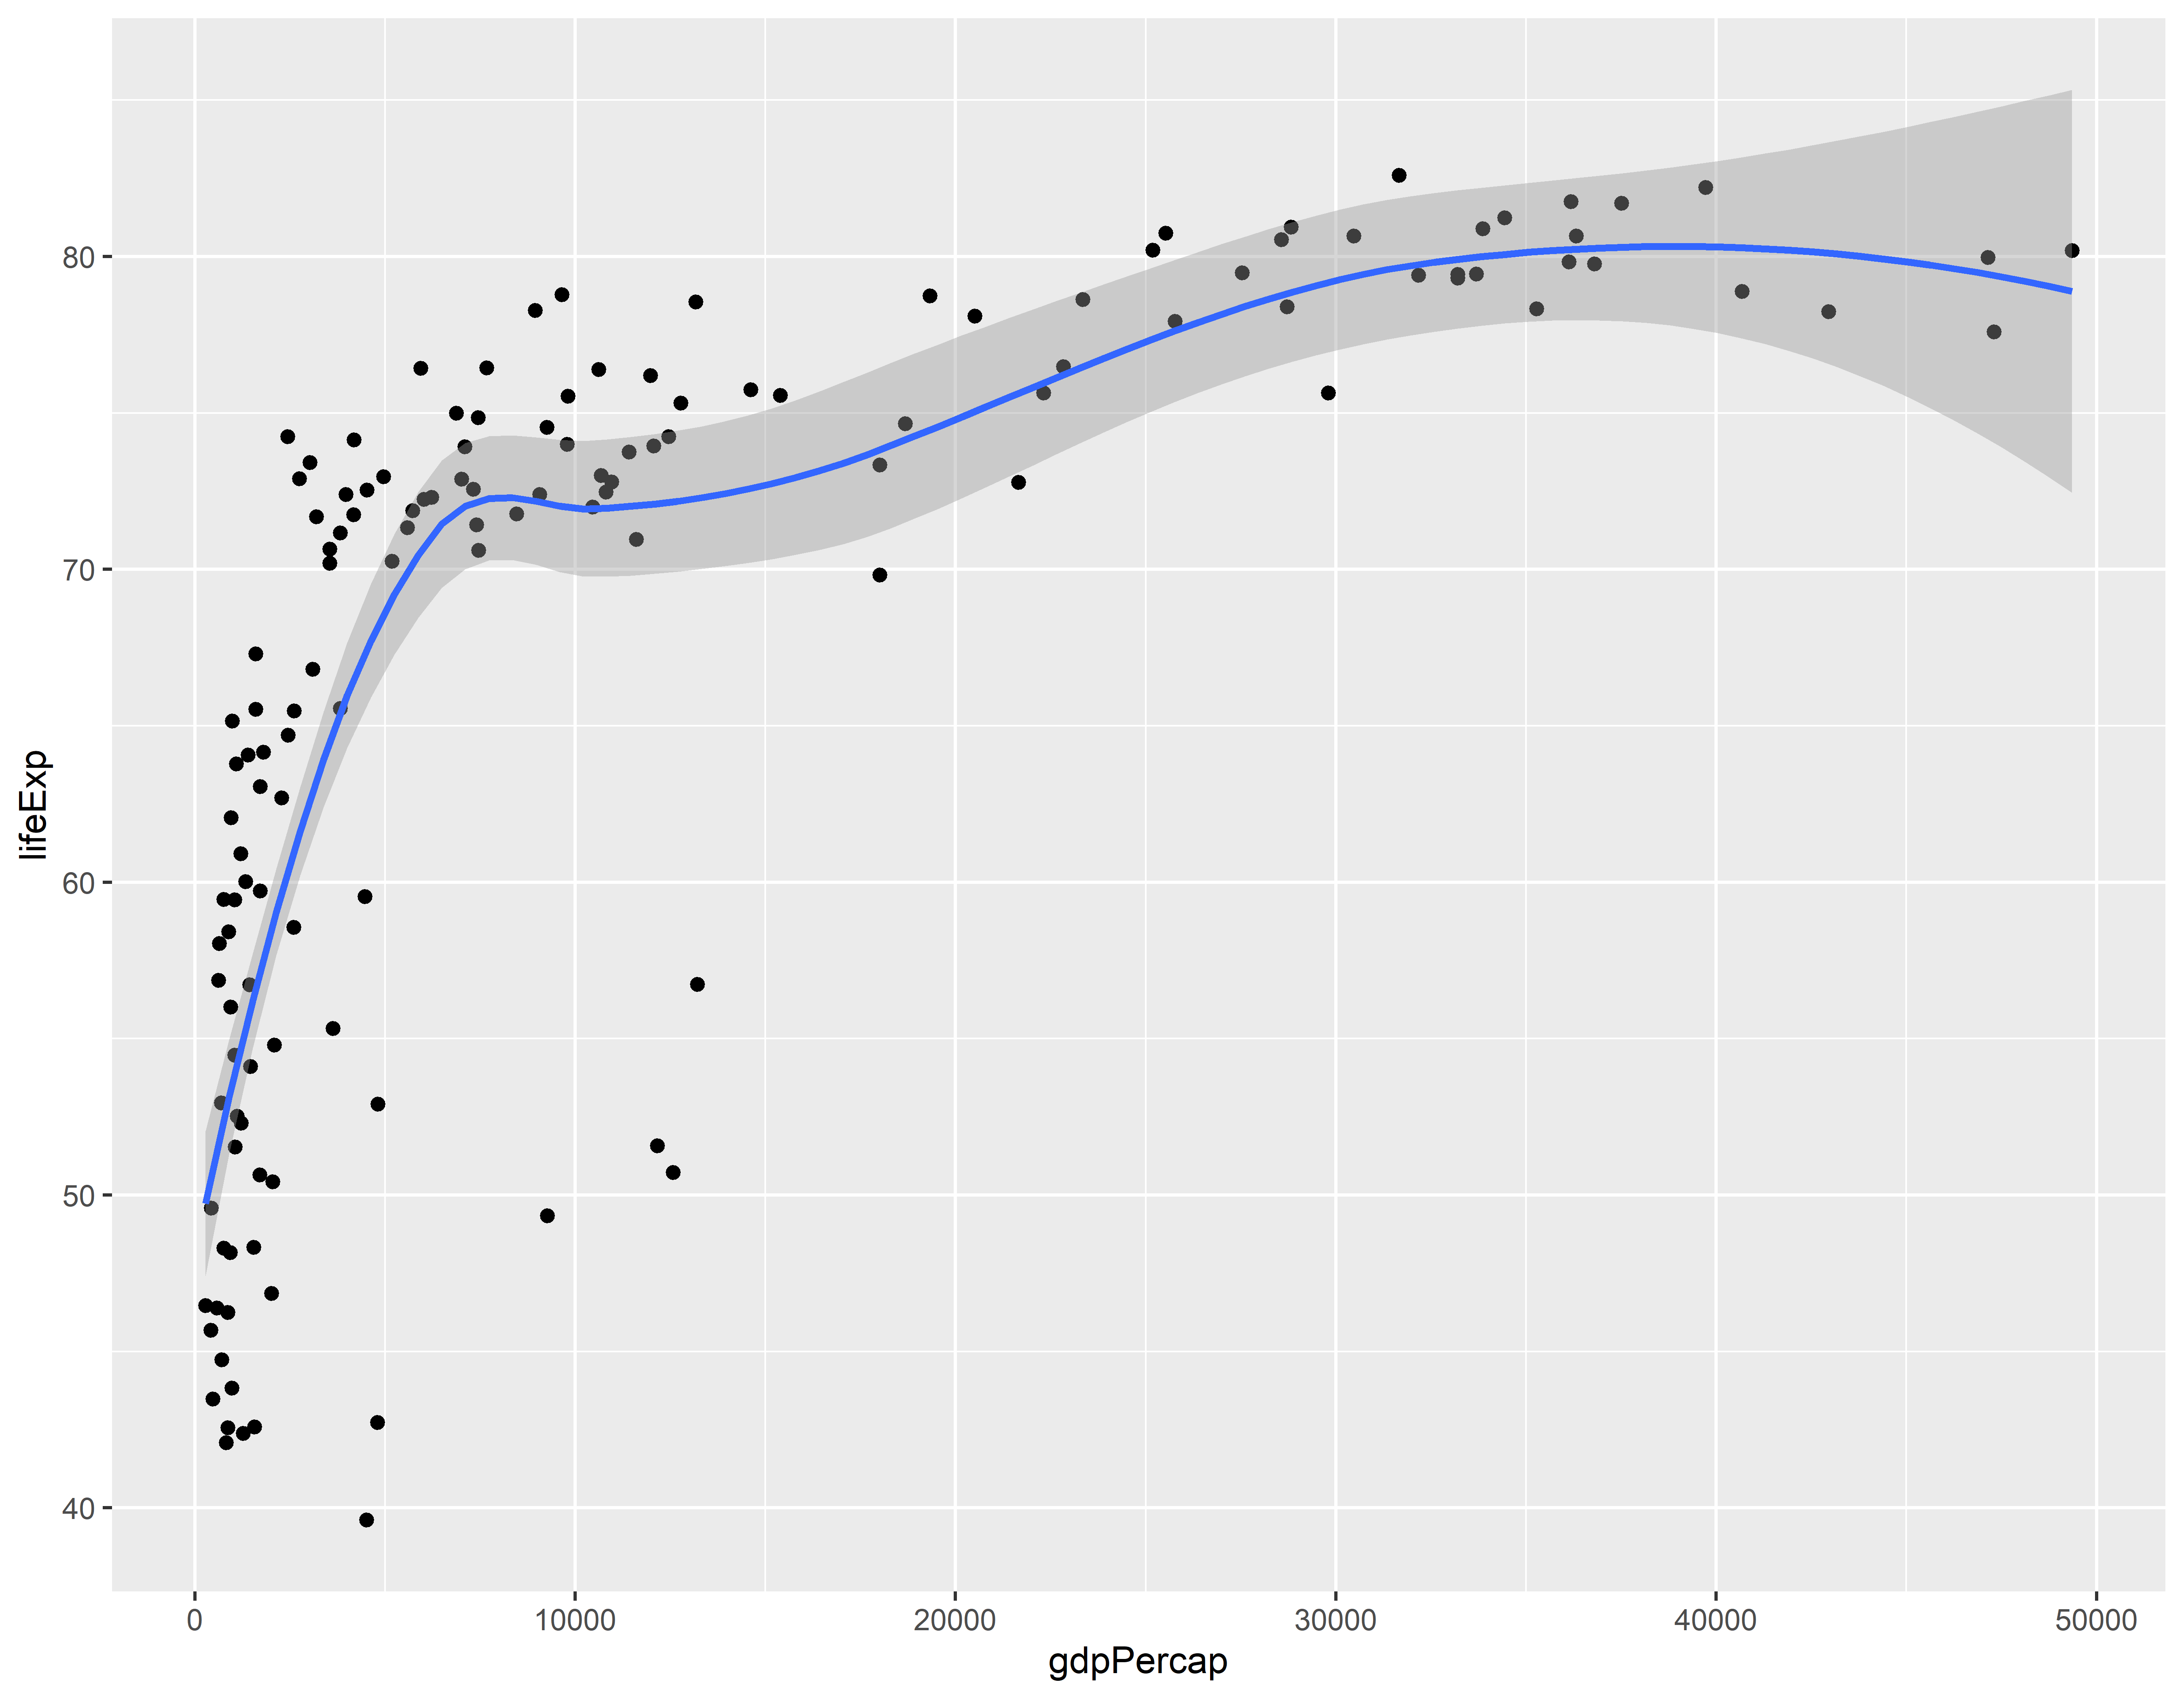
Usando um modelo linear ao invés do loess
ggplot(gap_07, aes(x = gdpPercap, y = lifeExp)) +
  geom_point() +
  geom_smooth(method = "lm")  +
  theme_minimal()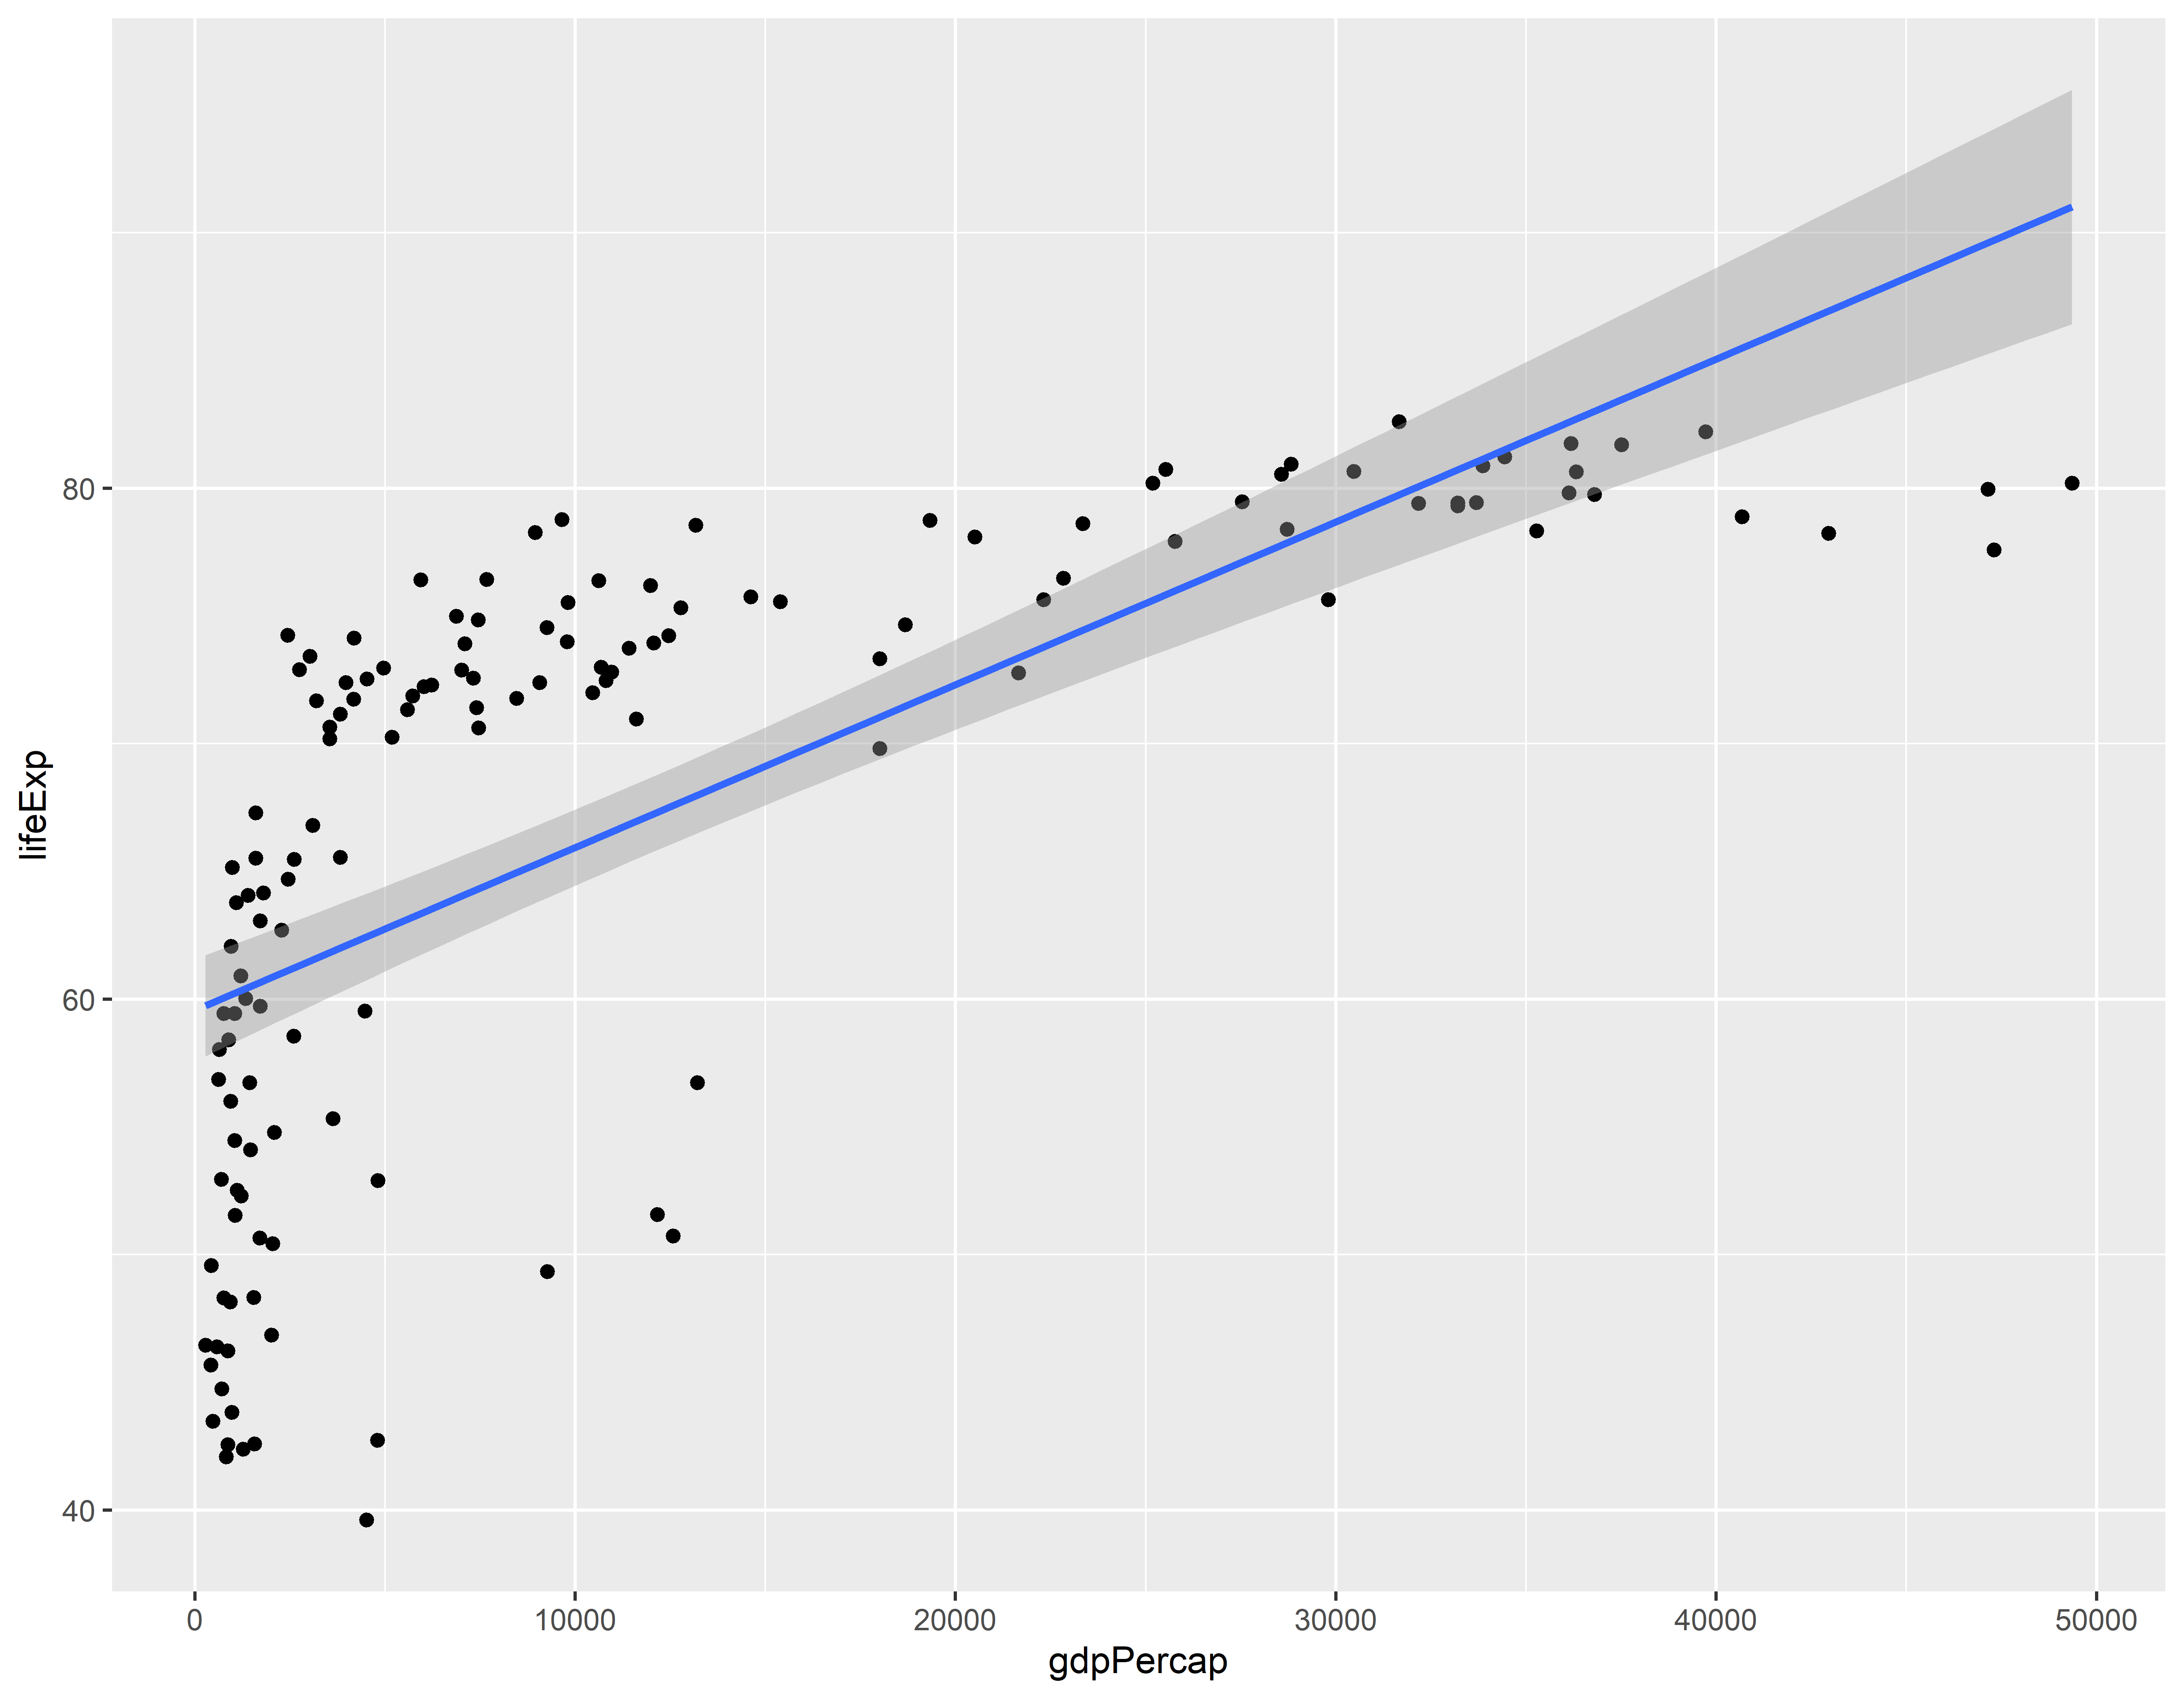
Usando basic splines para melhorar o ajuste
ggplot(gap_07, aes(x = gdpPercap, y = lifeExp)) +
  geom_point() +
  geom_smooth(method = "lm", formula = y ~ splines::bs(x, df = 3))  +
  theme_minimal()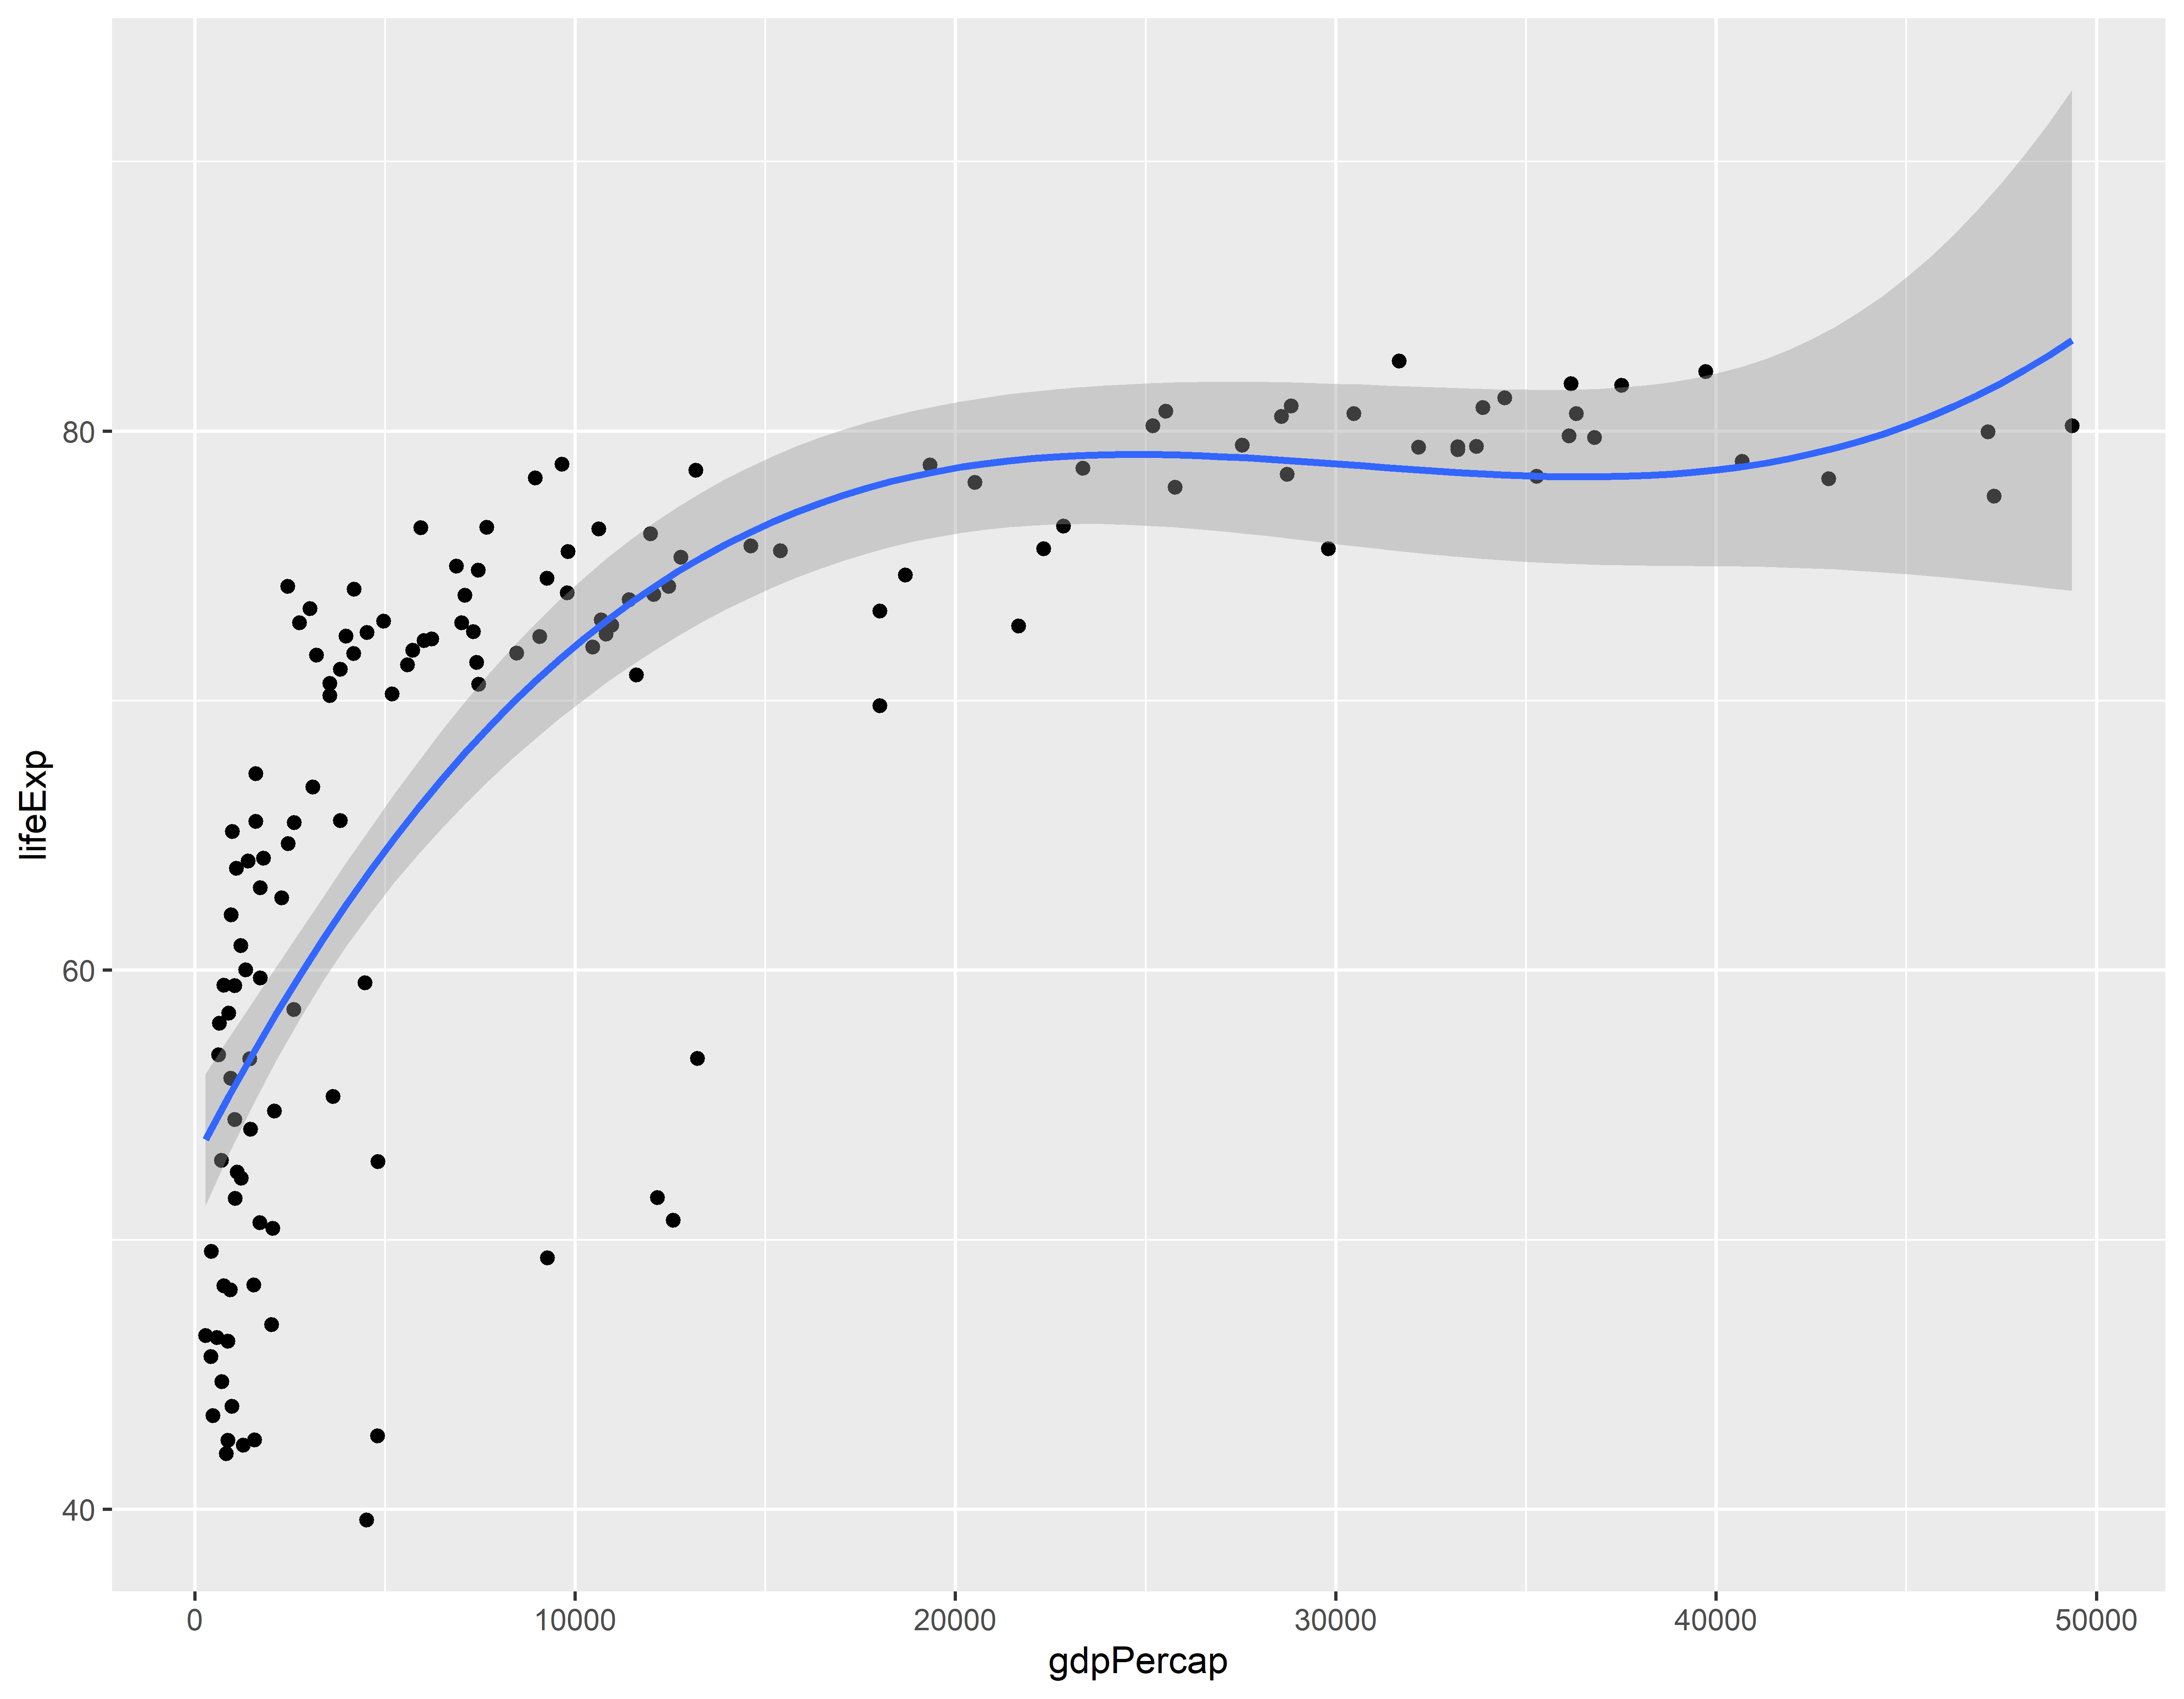
Usando o gam (general addtive models) com regressão spline
ggplot(gap_07, aes(x = gdpPercap, y = lifeExp)) +
  geom_point() +
  geom_smooth(method = "gam", formula = y ~ s(x))  +
  theme_minimal()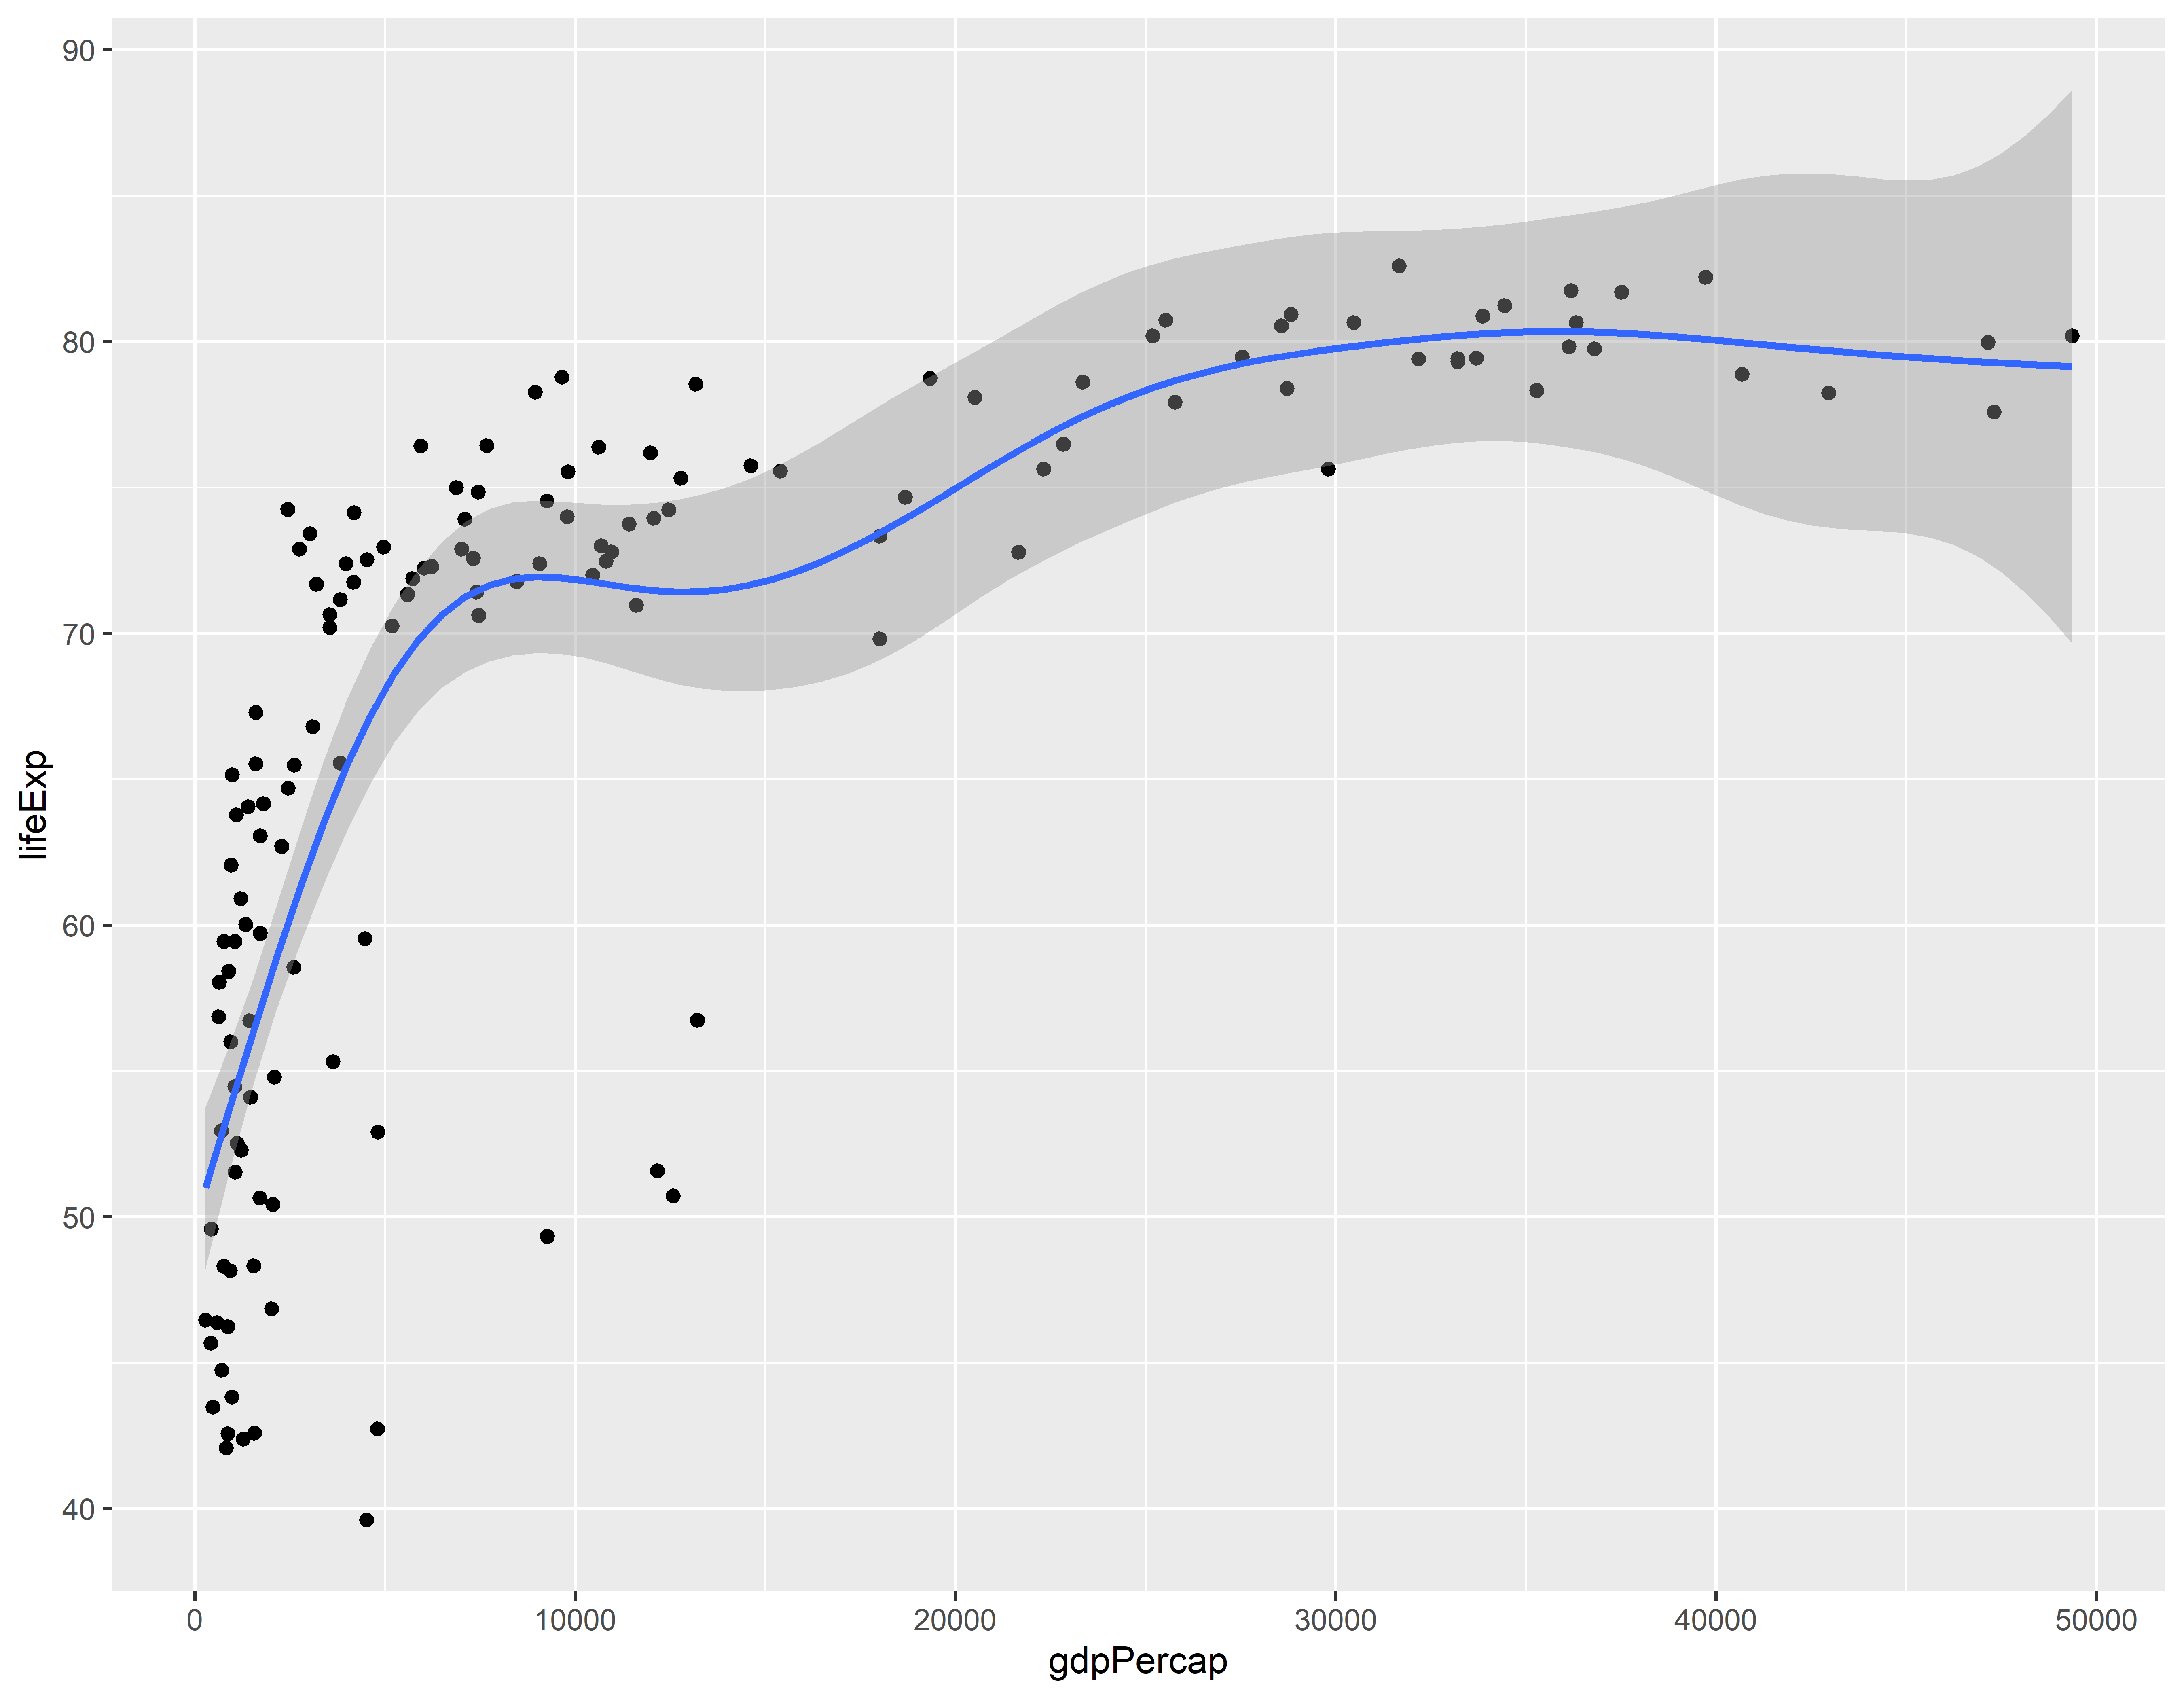
Começando a construir um gráfico do tipo facet com suavizações
ggplot(gap_07, aes(x = gdpPercap, y = lifeExp)) +
  geom_point() +
  theme_minimal()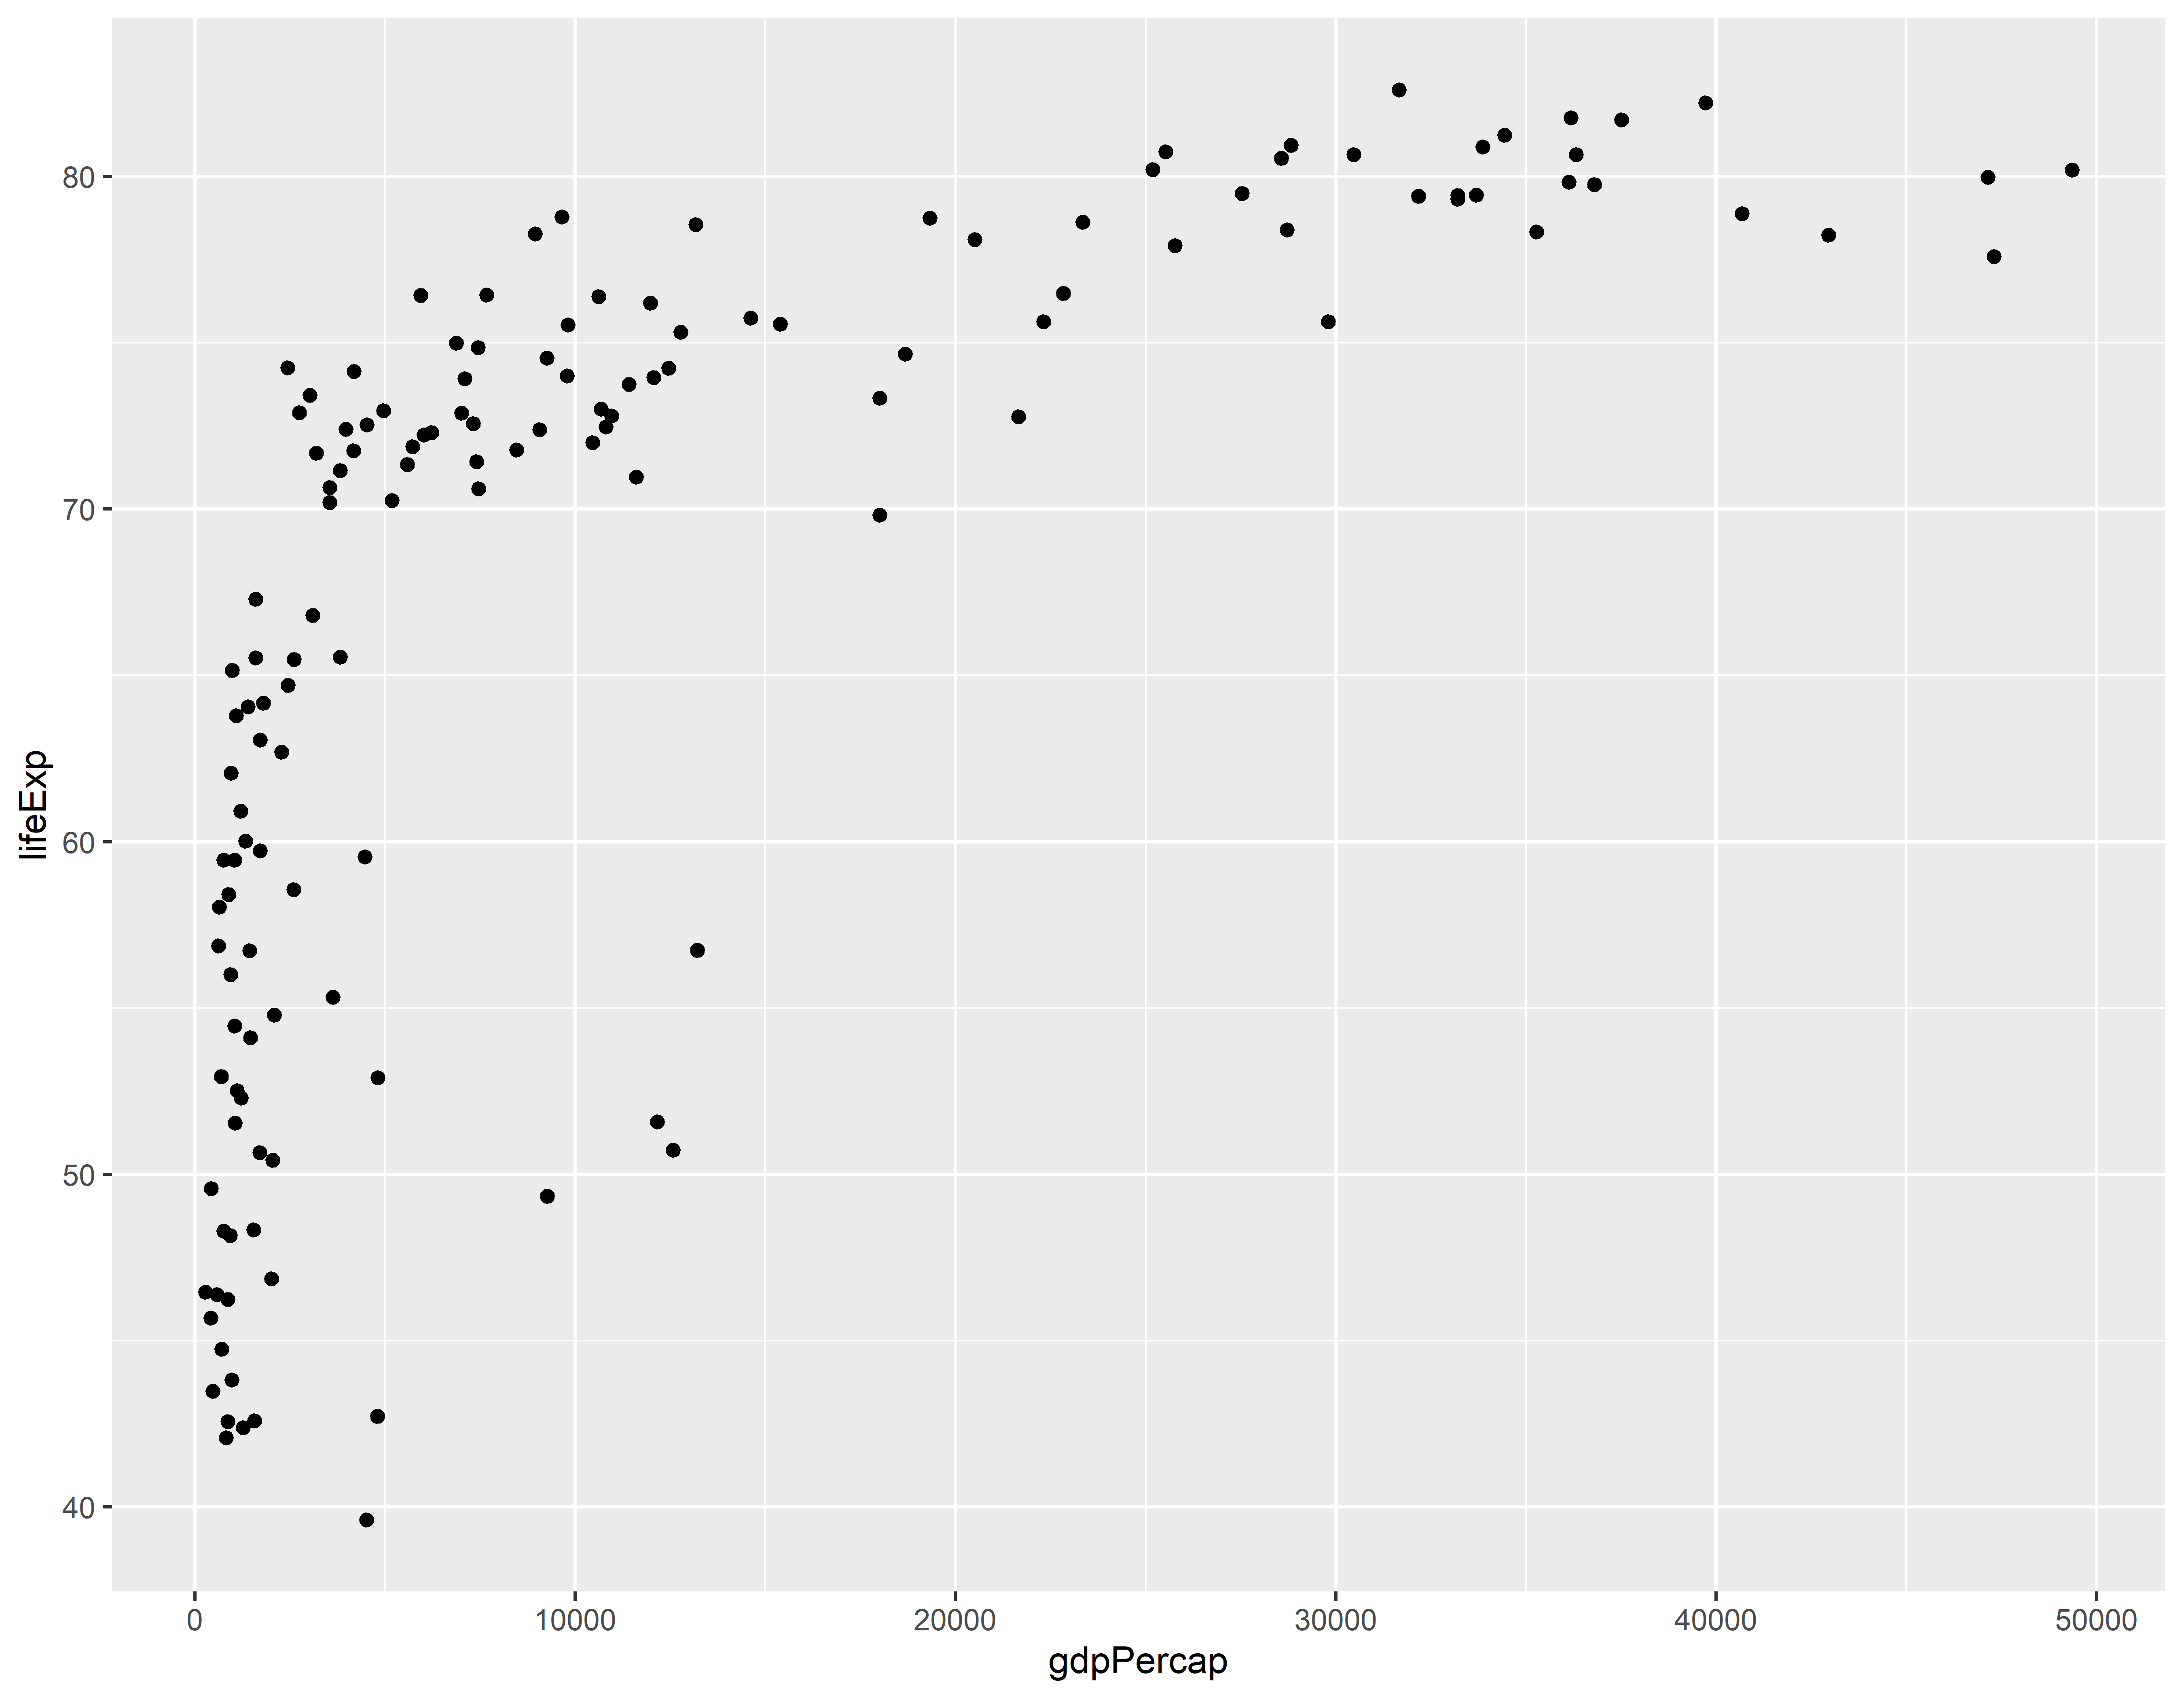
Dividindo por continente
ggplot(gap_07, aes(x = gdpPercap, y = lifeExp)) +
  geom_point() +
  facet_wrap(~ continent) +
  theme_minimal()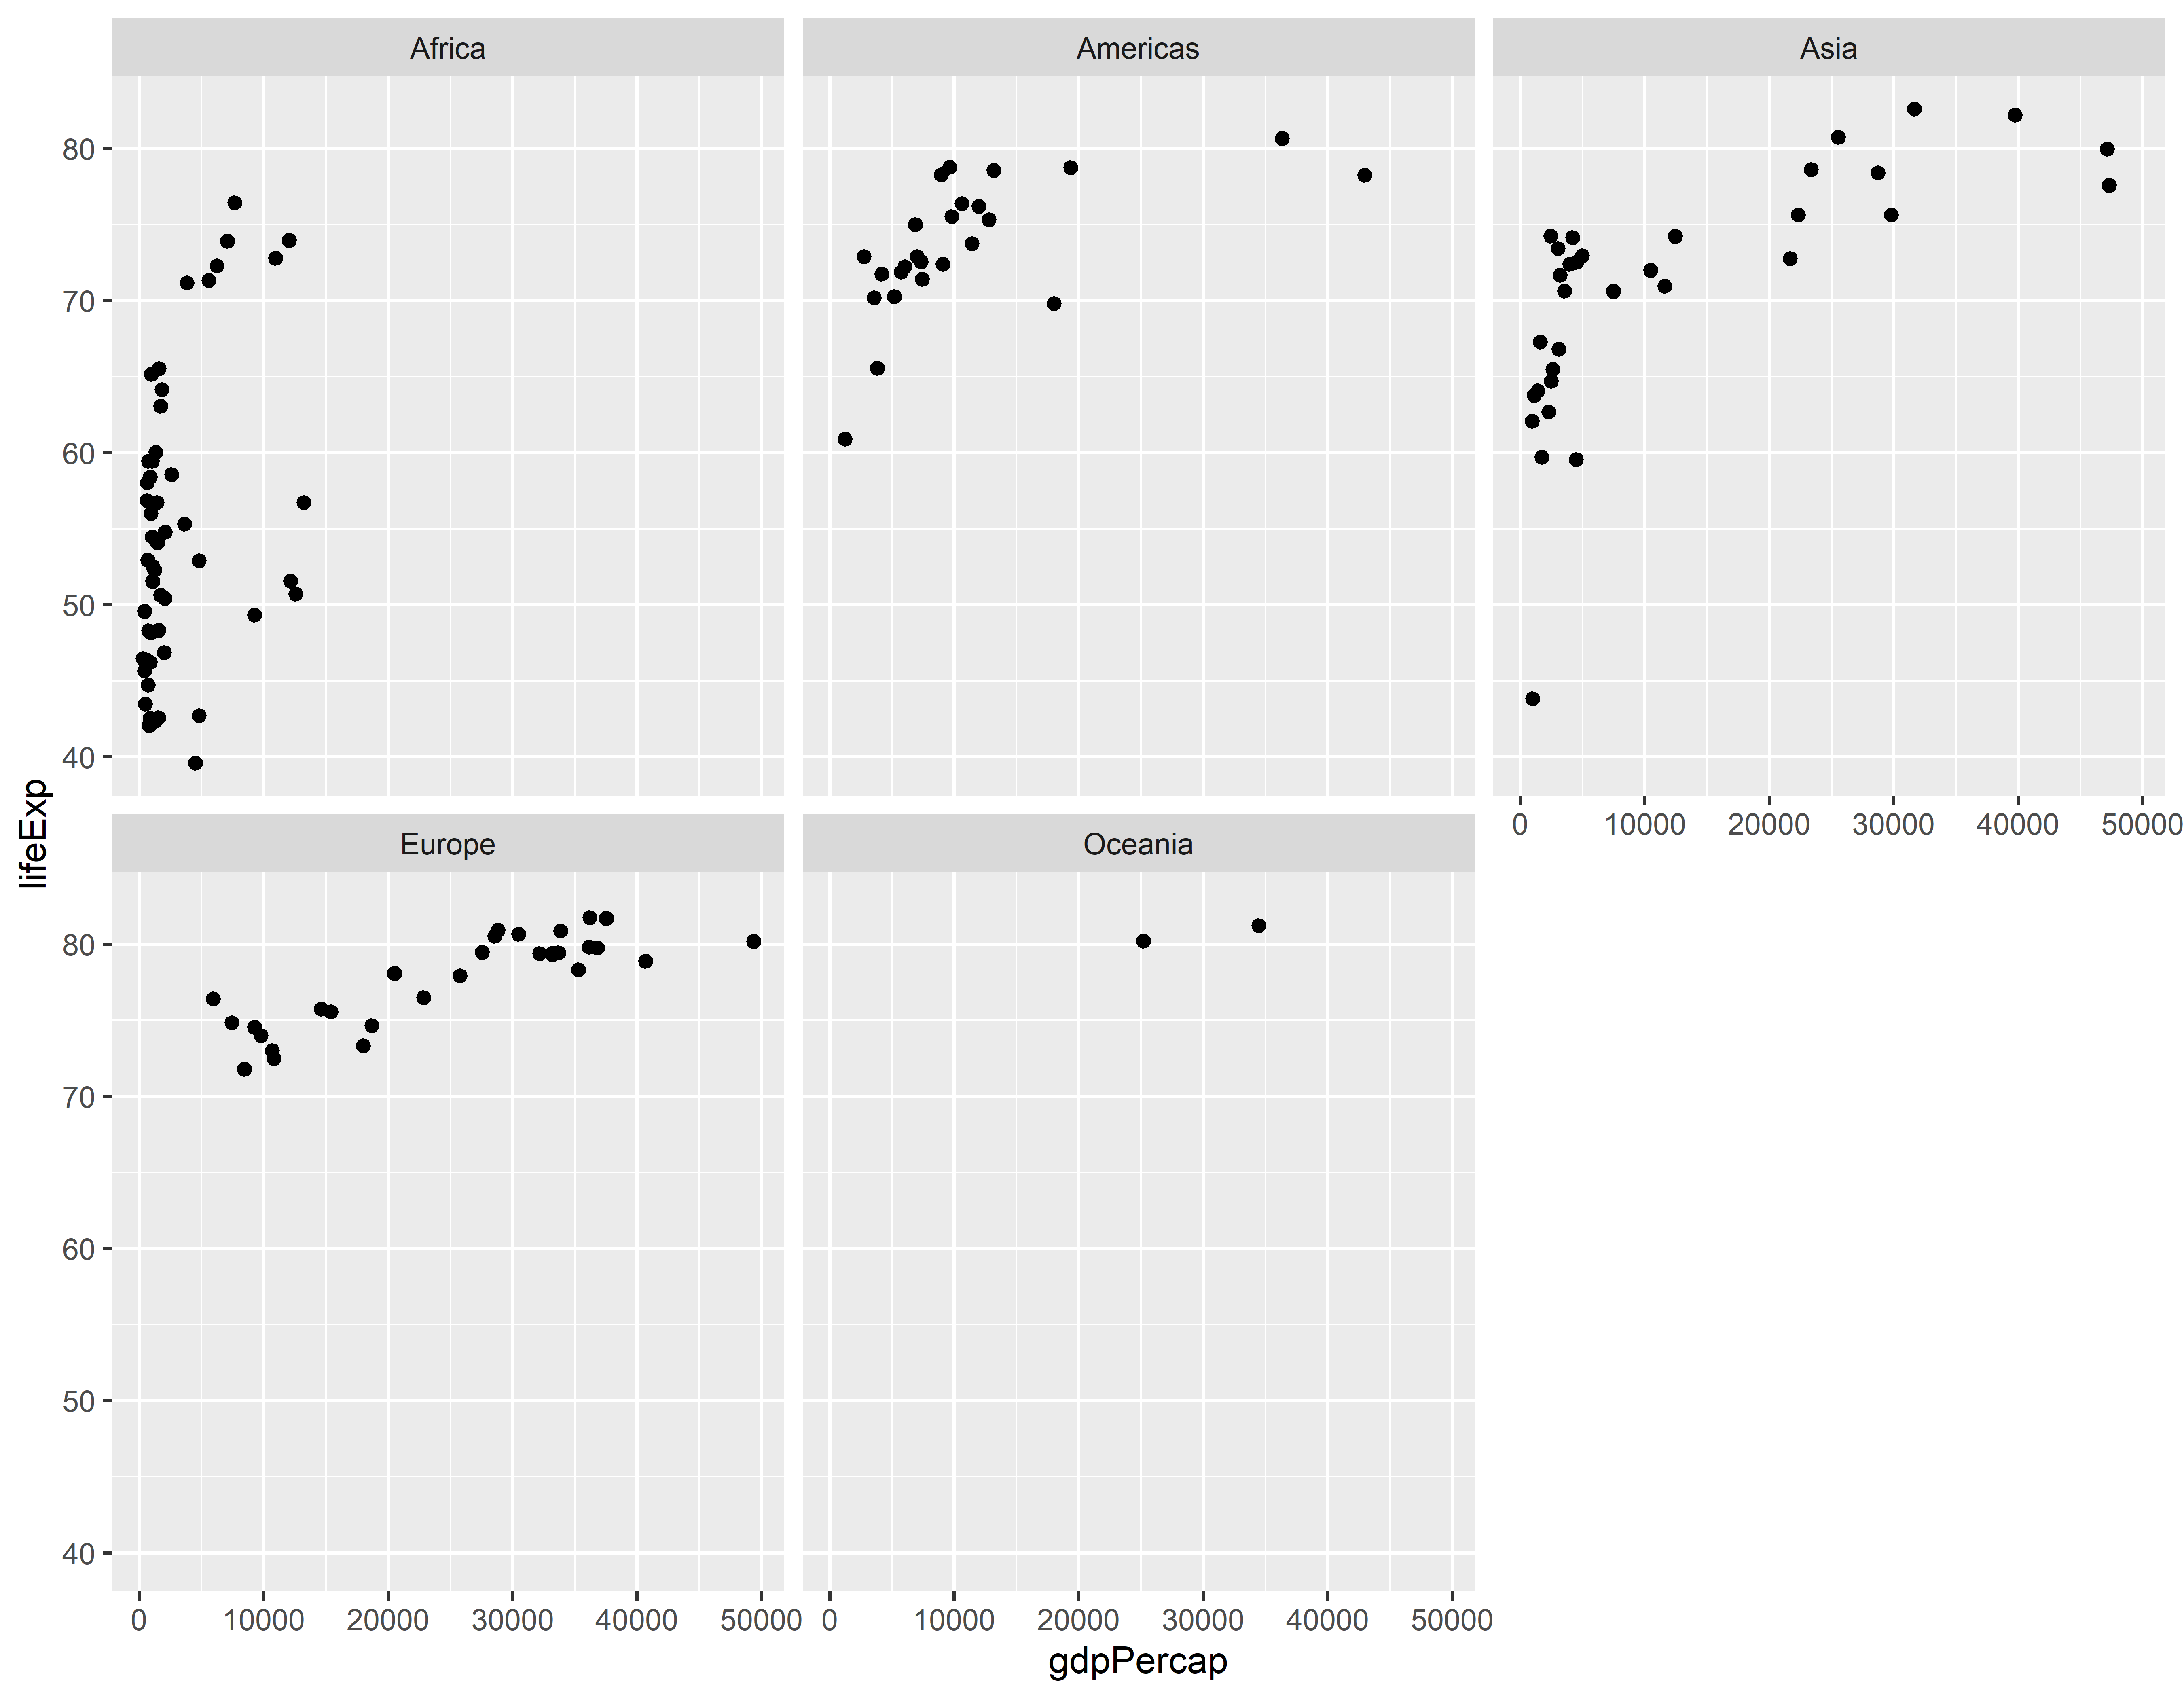
Adicionando suavizadores
ggplot(gap_07, aes(x = gdpPercap, y = lifeExp)) +
  geom_point() +
  geom_smooth() +
  facet_wrap(~ continent) +
  theme_minimal()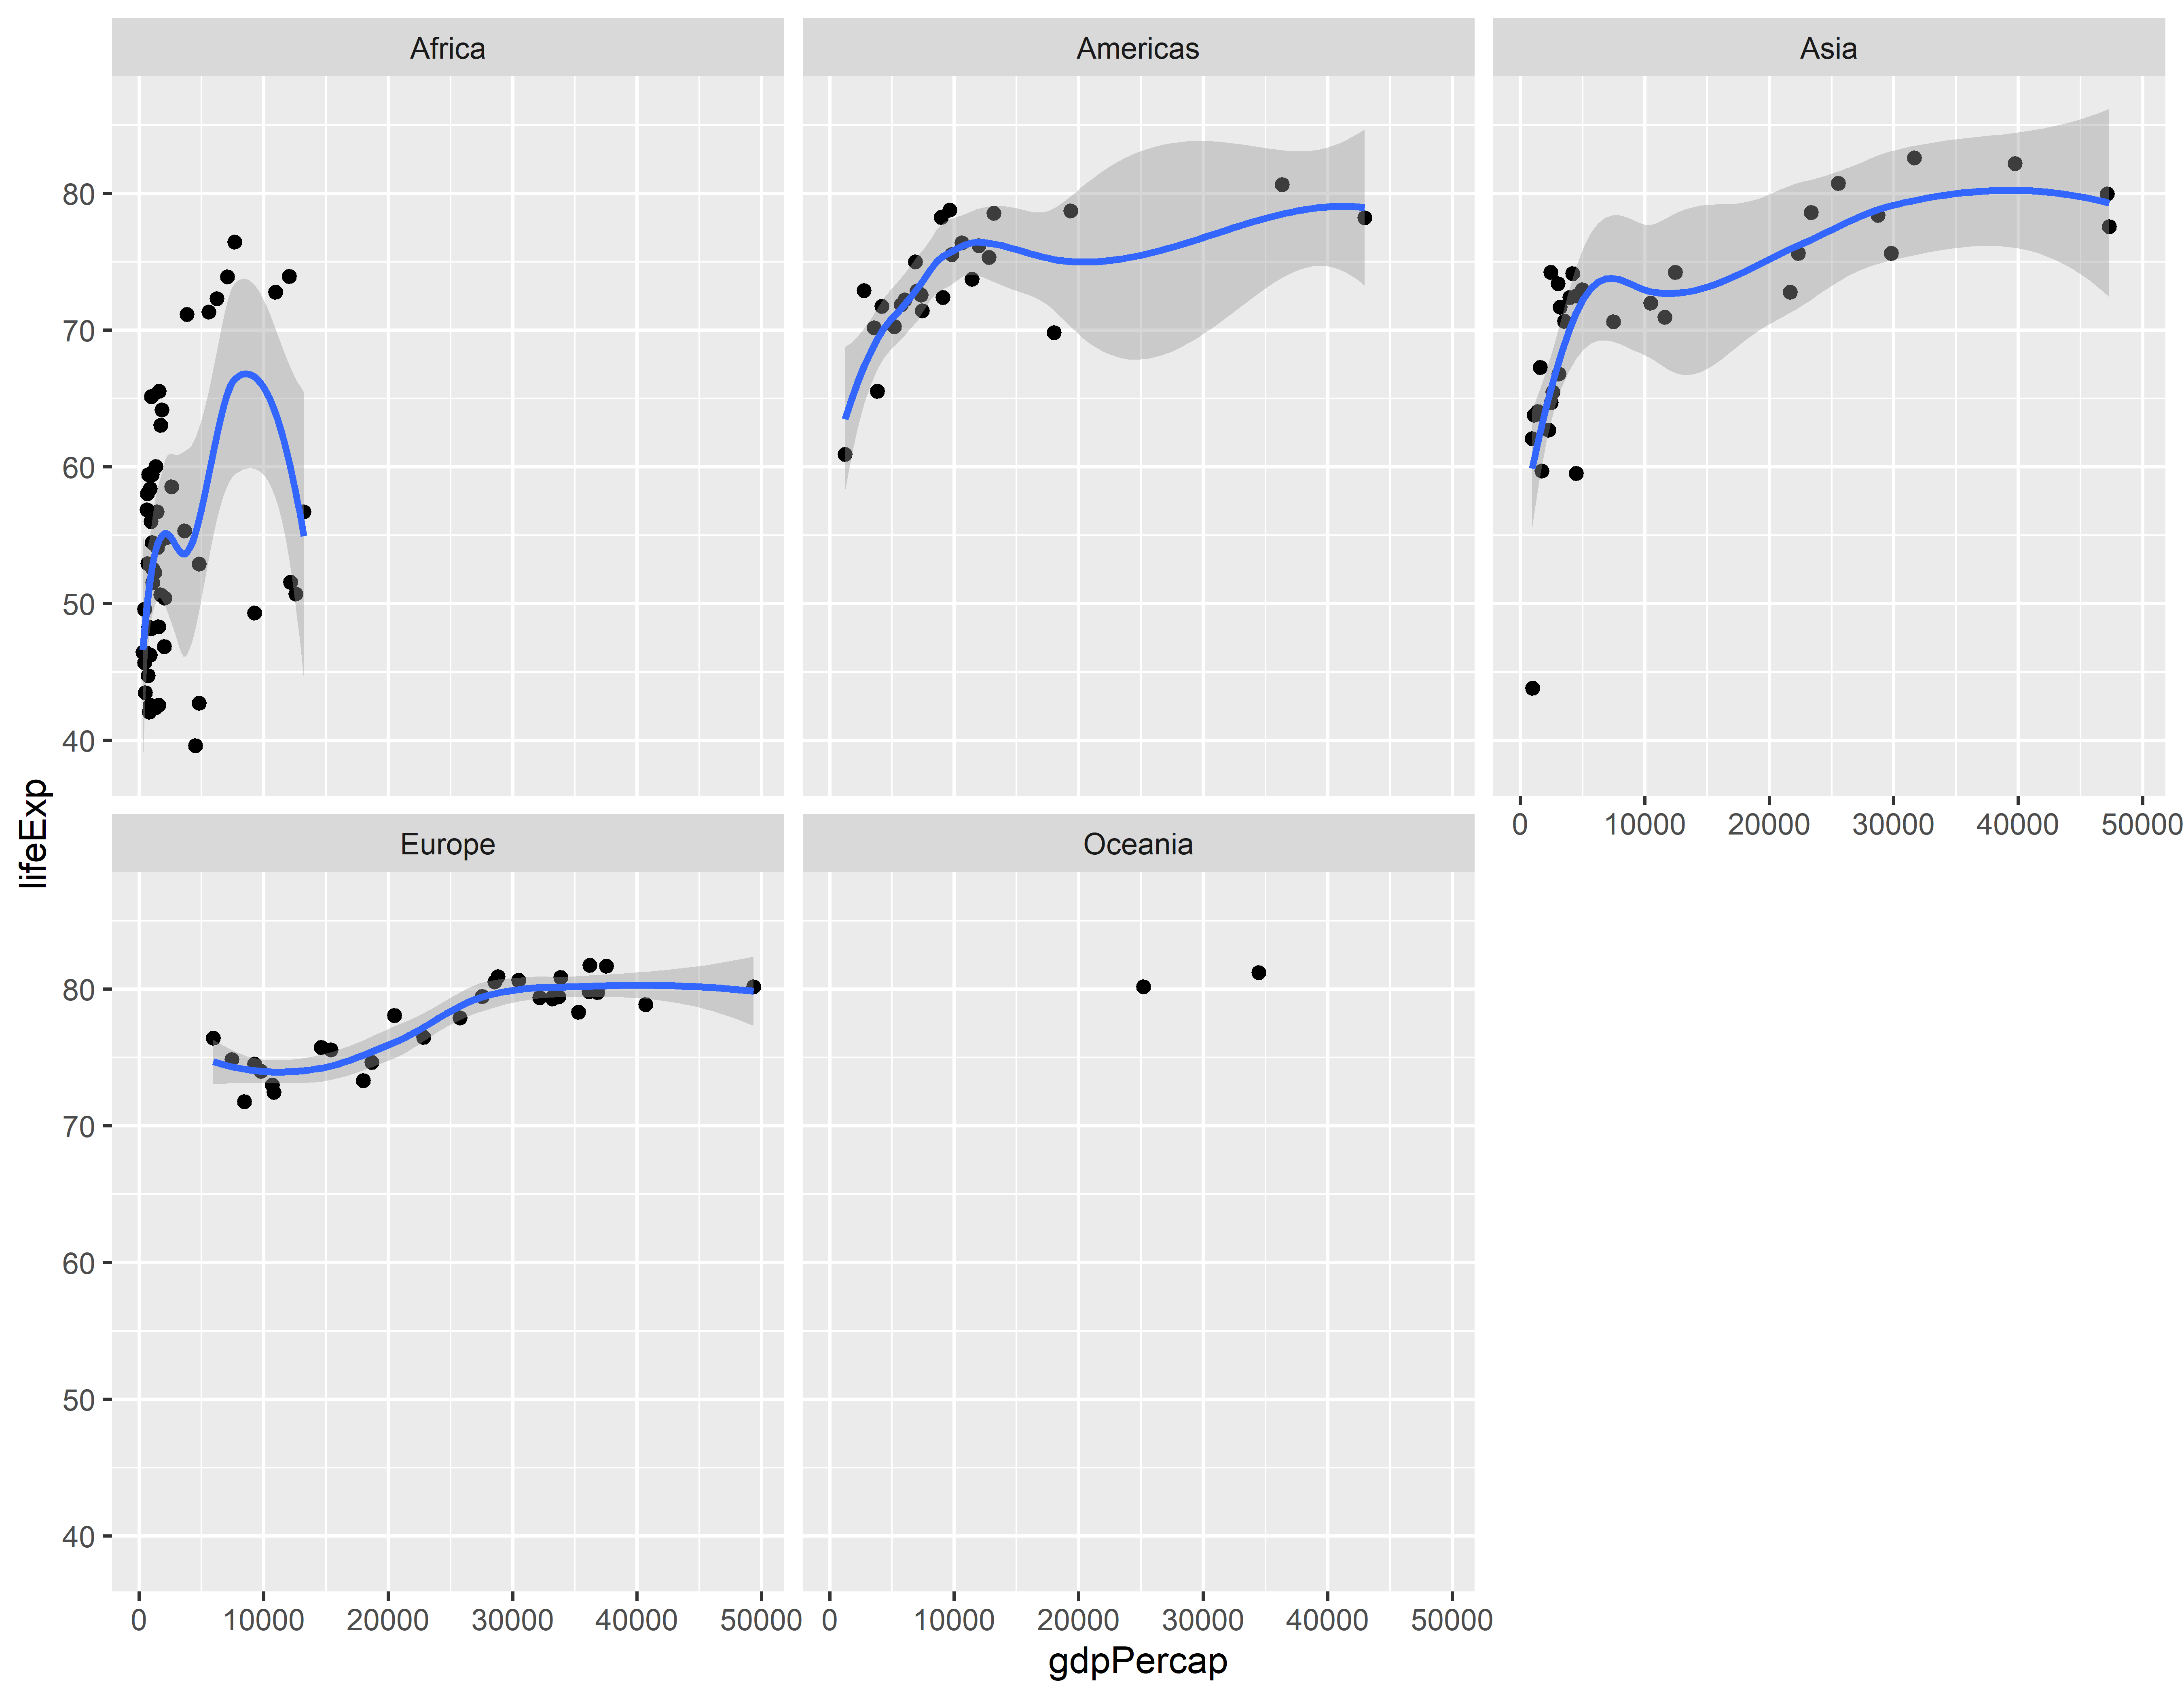
Colorindo por continente
ggplot(gap_07, aes(x = gdpPercap, y = lifeExp, color = continent)) +
  geom_point() +
  geom_smooth() +
  facet_wrap(~ continent) +
theme_minimal() 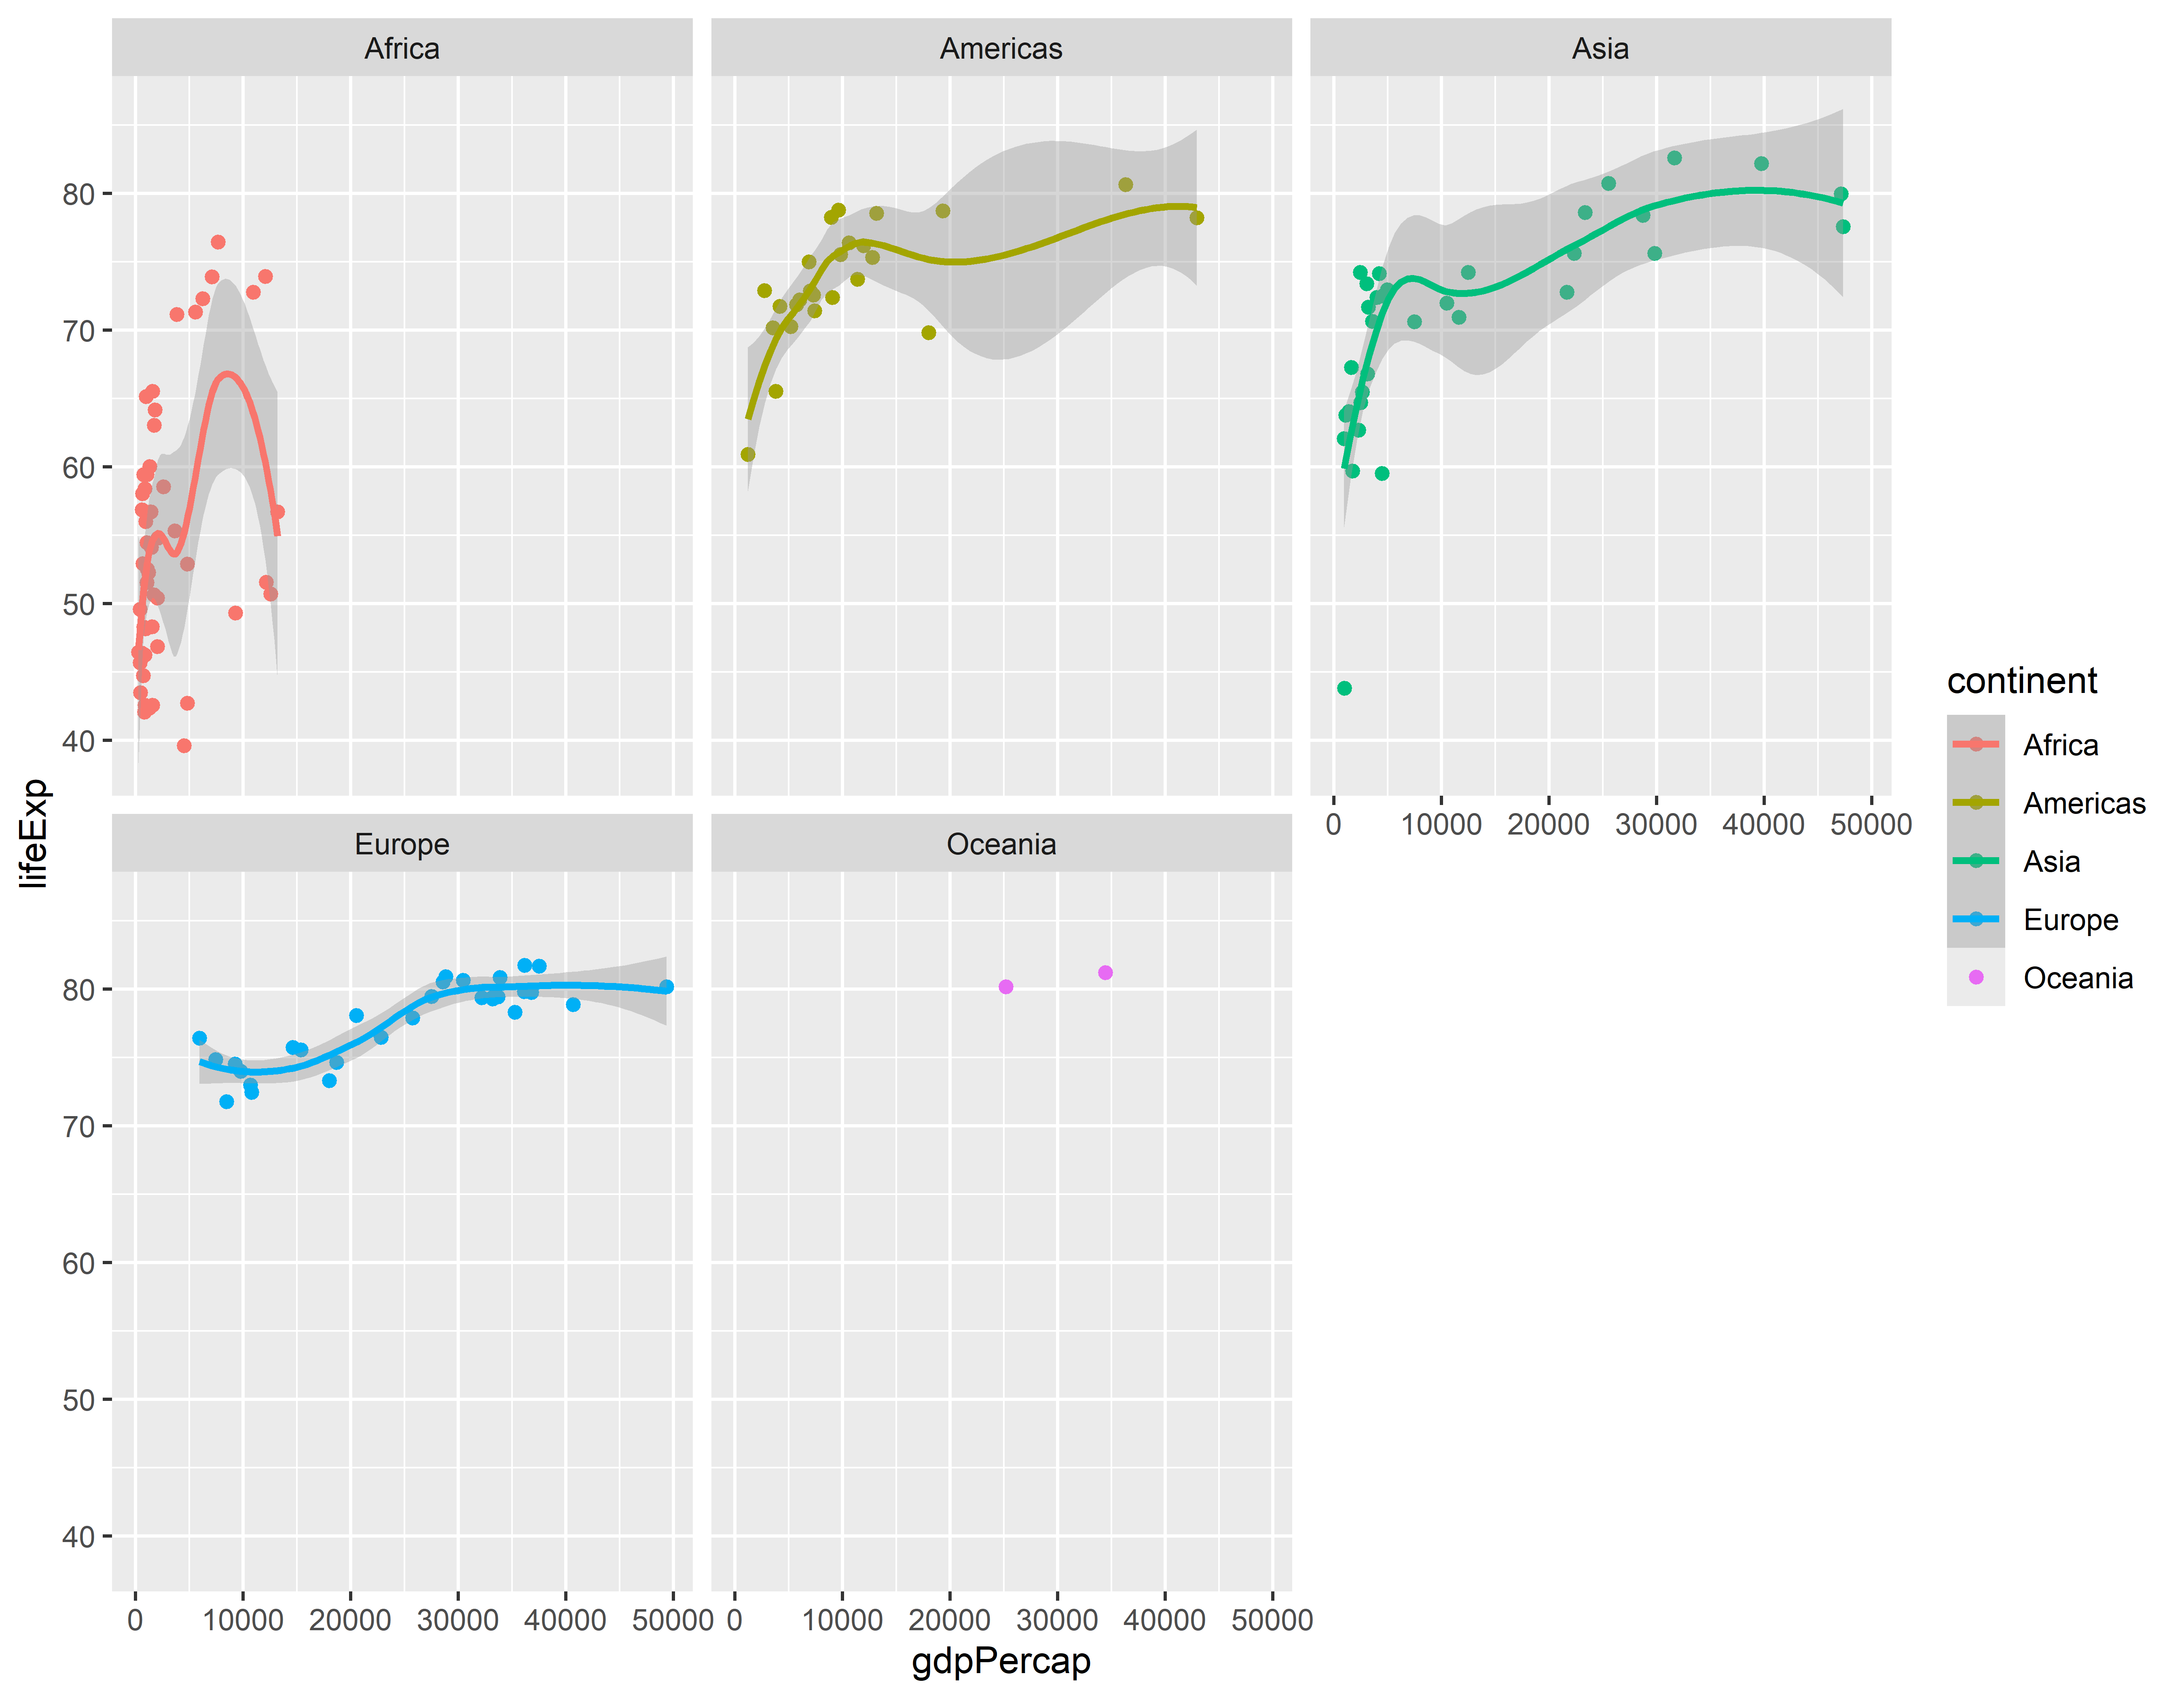
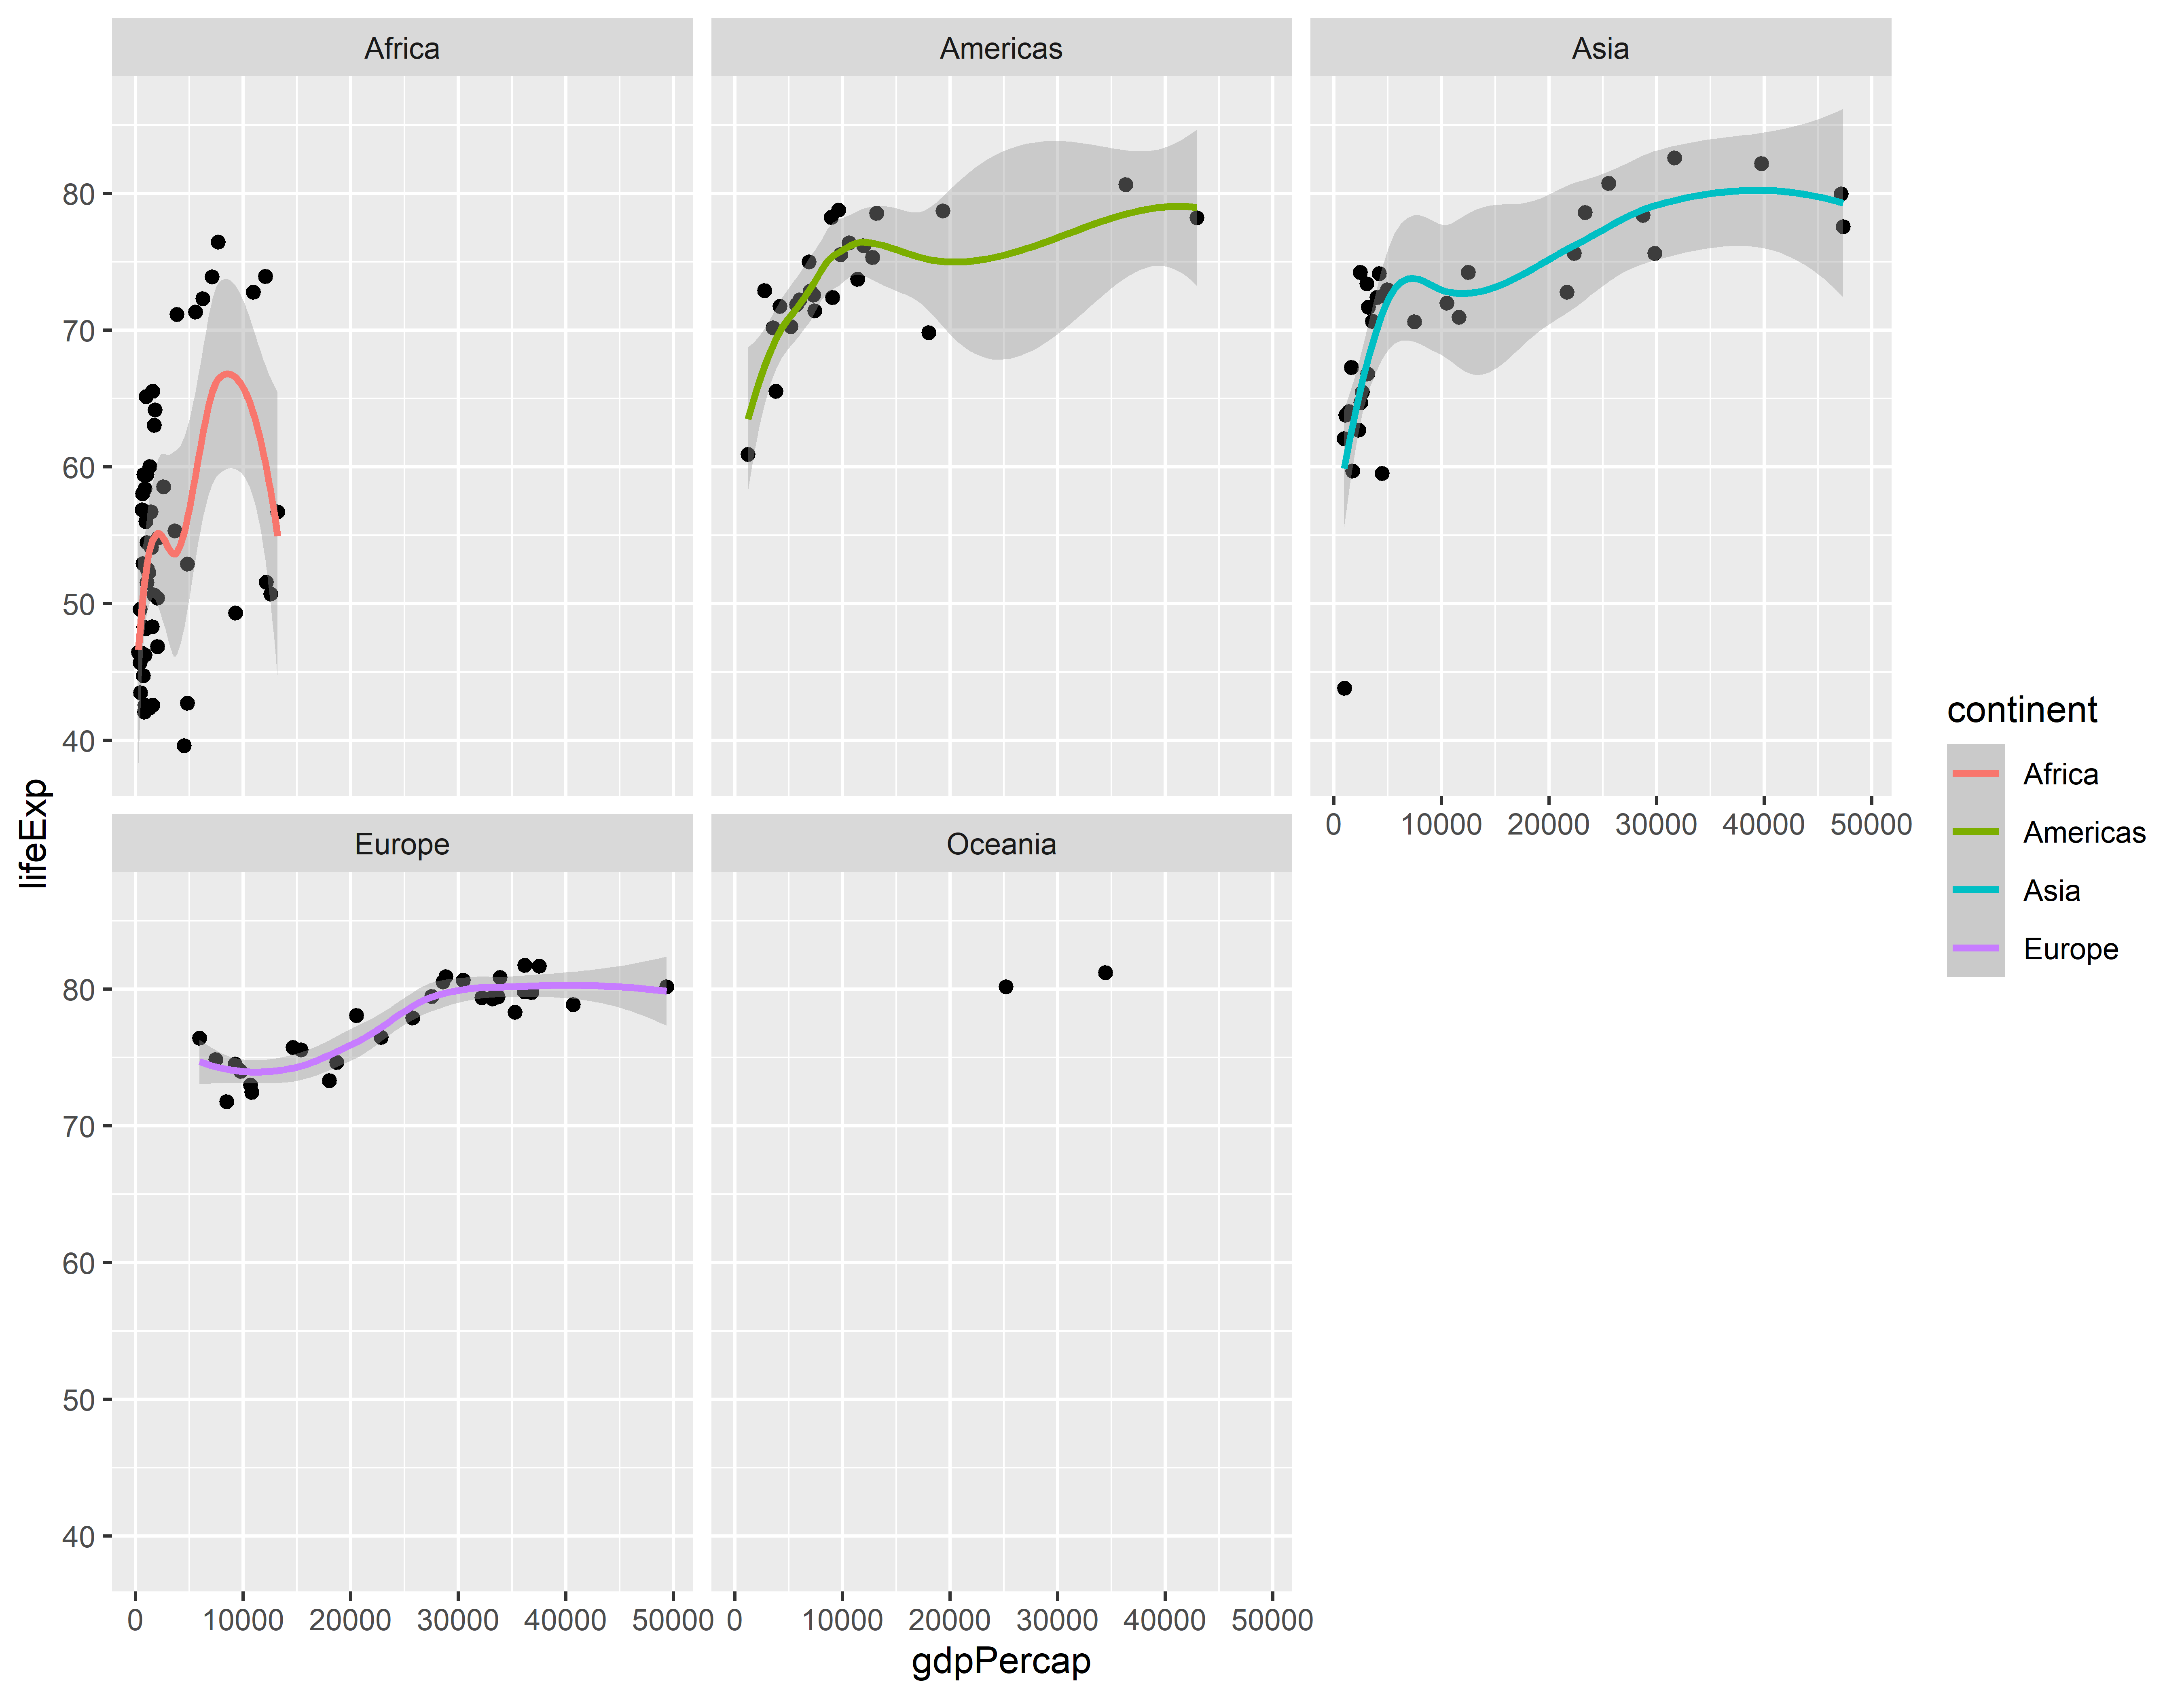
Colorindo somente a curva
ggplot(gap_07, aes(x = gdpPercap, y = lifeExp)) +
  geom_point() +
  geom_smooth(aes(color = continent)) +
  facet_wrap(~ continent) +
  theme_minimal()