Explorando Dados
Carregando bibliotecas
O que temos aqui?
head(iris)#> Sepal.Length Sepal.Width Petal.Length Petal.Width Species
#> 1 5.1 3.5 1.4 0.2 setosa
#> 2 4.9 3.0 1.4 0.2 setosa
#> 3 4.7 3.2 1.3 0.2 setosa
#> 4 4.6 3.1 1.5 0.2 setosa
#> 5 5.0 3.6 1.4 0.2 setosa
#> 6 5.4 3.9 1.7 0.4 setosa#> Species n
#> 1 setosa 50
#> 2 versicolor 50
#> 3 virginica 50Quais são as médias?
#> # A tibble: 3 × 5
#>   Species    Sepal.Length Sepal.Width Petal.Length Petal.Width
#>   <fct>             <dbl>       <dbl>        <dbl>       <dbl>
#> 1 setosa             5.01        3.43         1.46       0.246
#> 2 versicolor         5.94        2.77         4.26       1.33
#> 3 virginica          6.59        2.97         5.55       2.03
Vamos ver se temos alguma relação entre as variáveis
iris %>%
  group_by(Species) %>%
  ggplot(aes(x=Sepal.Width, y=Sepal.Length, color=Species)) +
  geom_point() +
  theme_minimal()
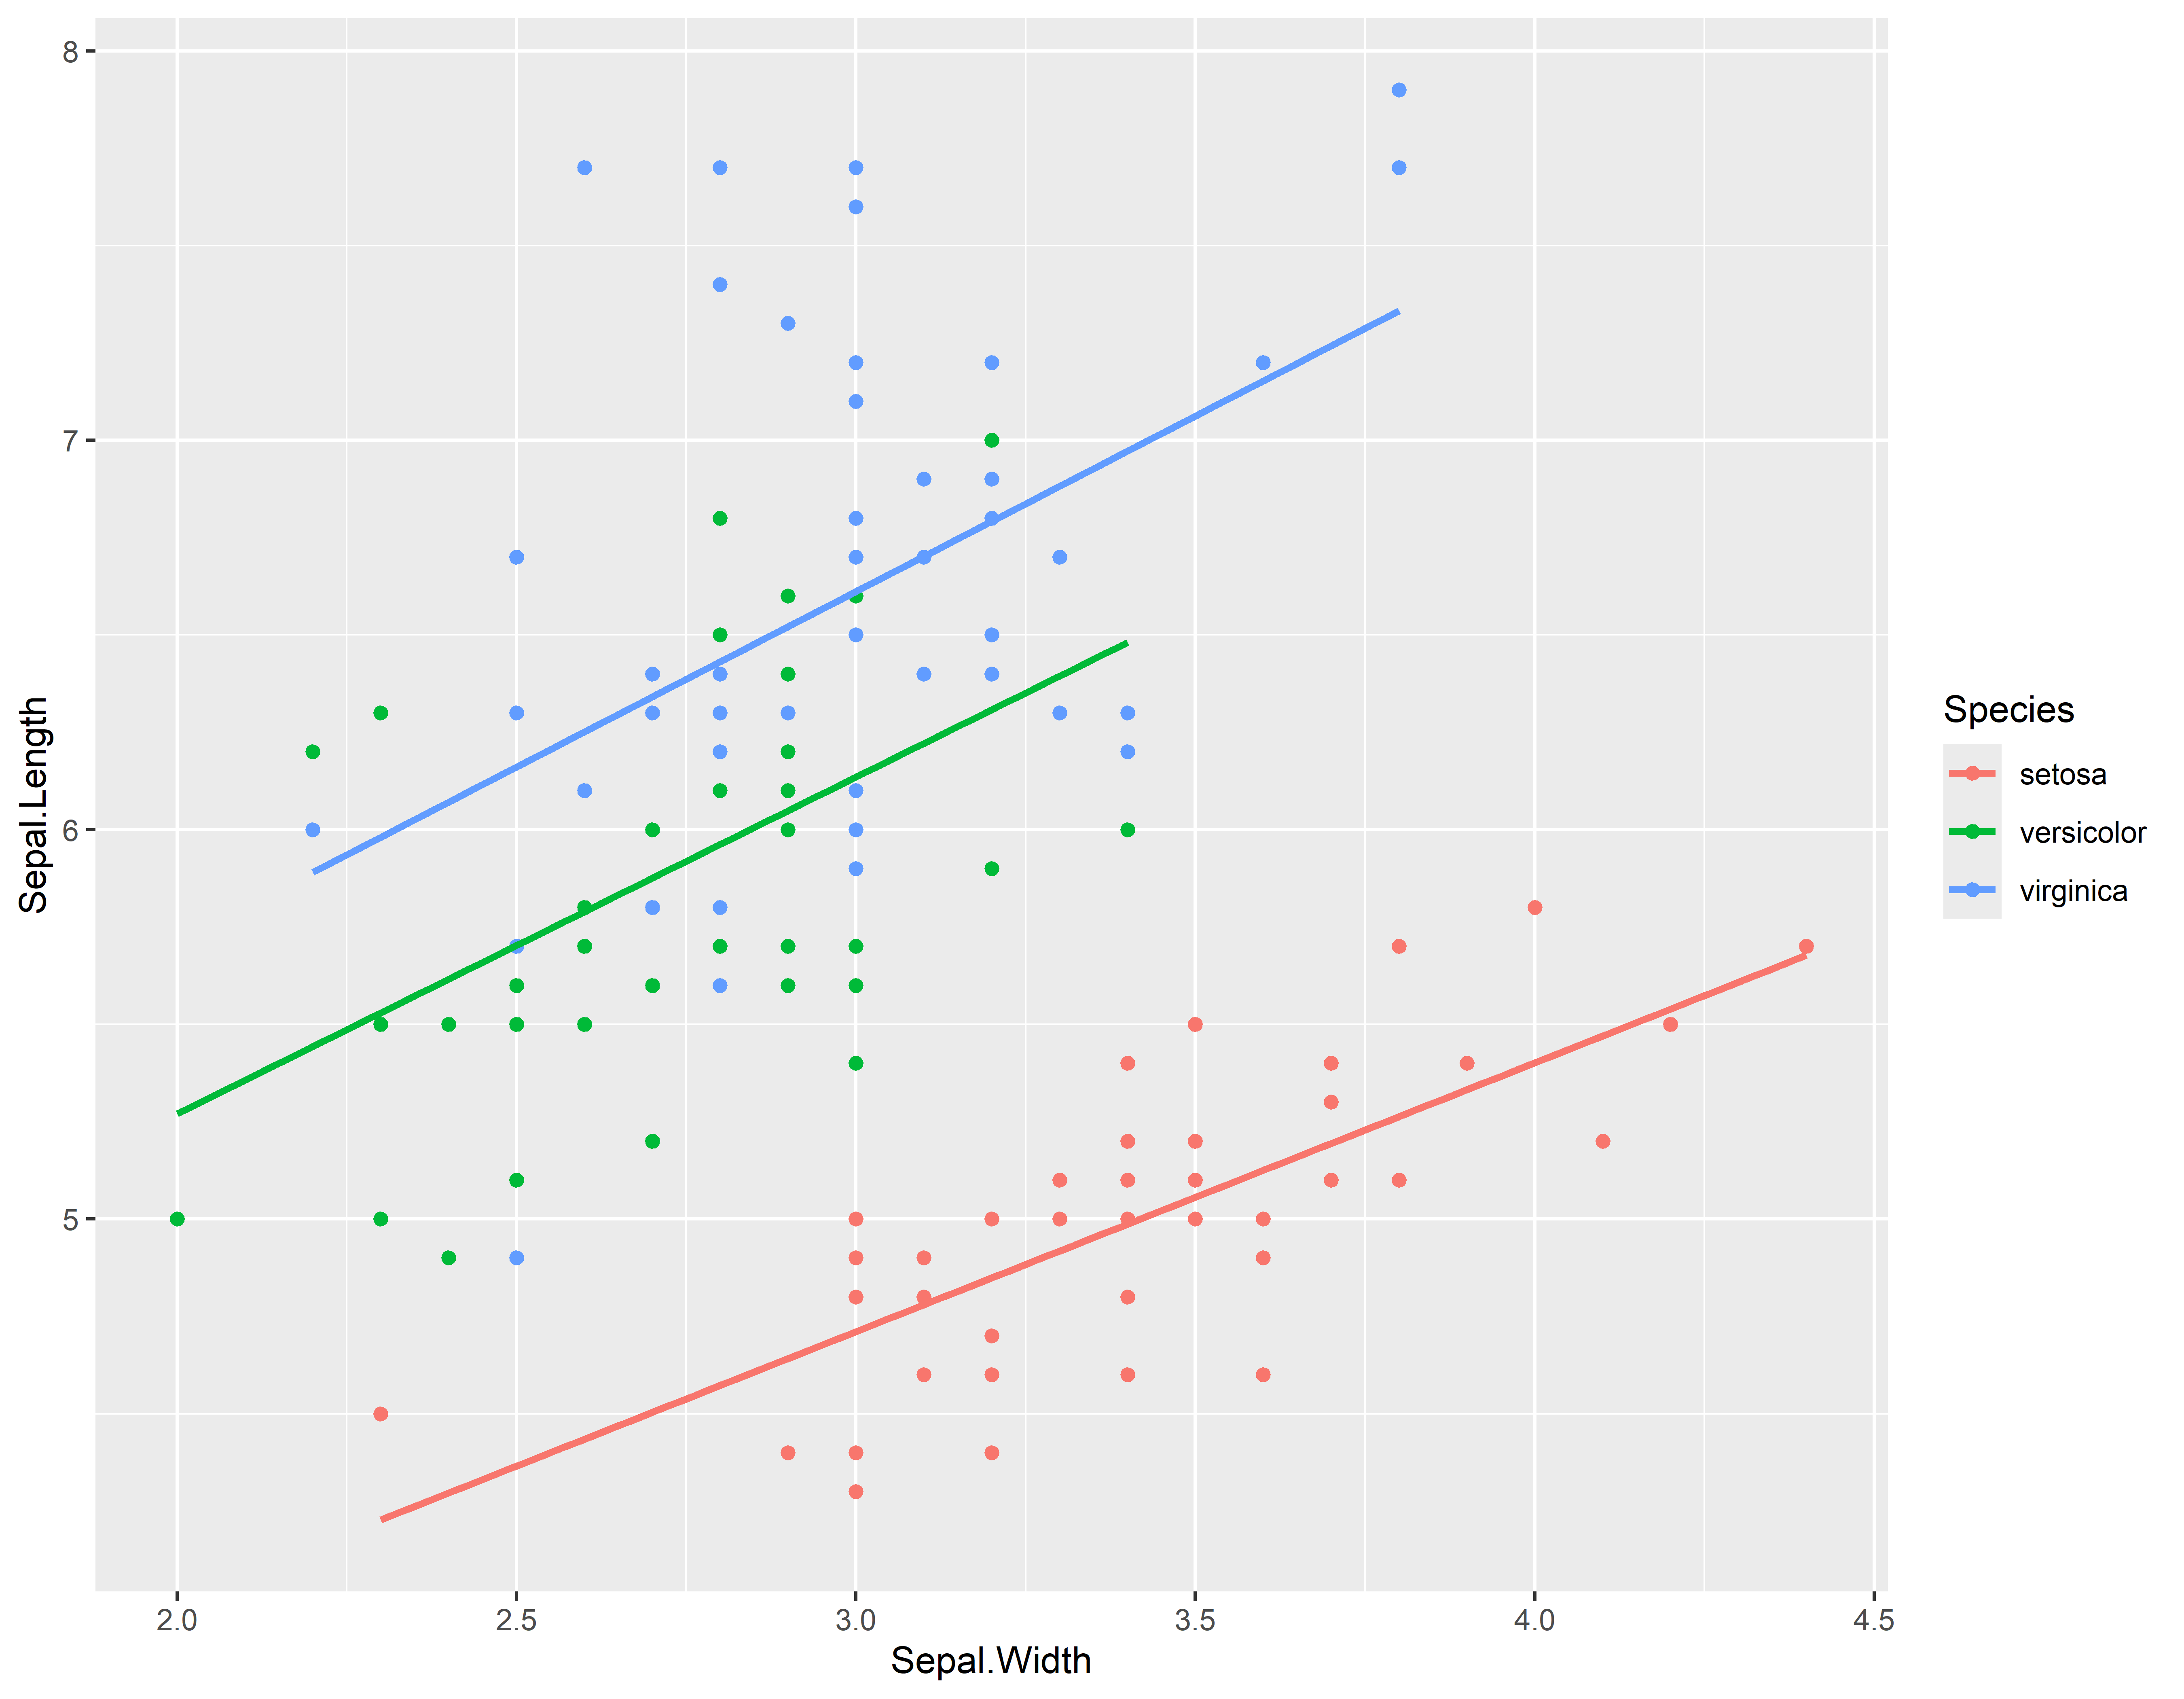
Vamos ver se temos alguma relação entre as variáveis
iris %>%
  group_by(Species) %>%
  ggplot(aes(x=Sepal.Width, y=Sepal.Length, color=Species)) +
  geom_point() +
  geom_smooth(method = "lm", se=FALSE) +
  labs(title = "Relação entre Sepal Width e Sepal Length",
       x = "Largura (cm)",
       y = "Comprimento (cm)") +
  theme_minimal()
#> `geom_smooth()` using formula = 'y ~ x'
Vamos ver se temos alguma relação entre as variáveis
iris %>%
  group_by(Species) %>%
  ggplot(aes(x=Petal.Width, y=Petal.Length, color=Species)) +
  geom_point() +
  theme_minimal()
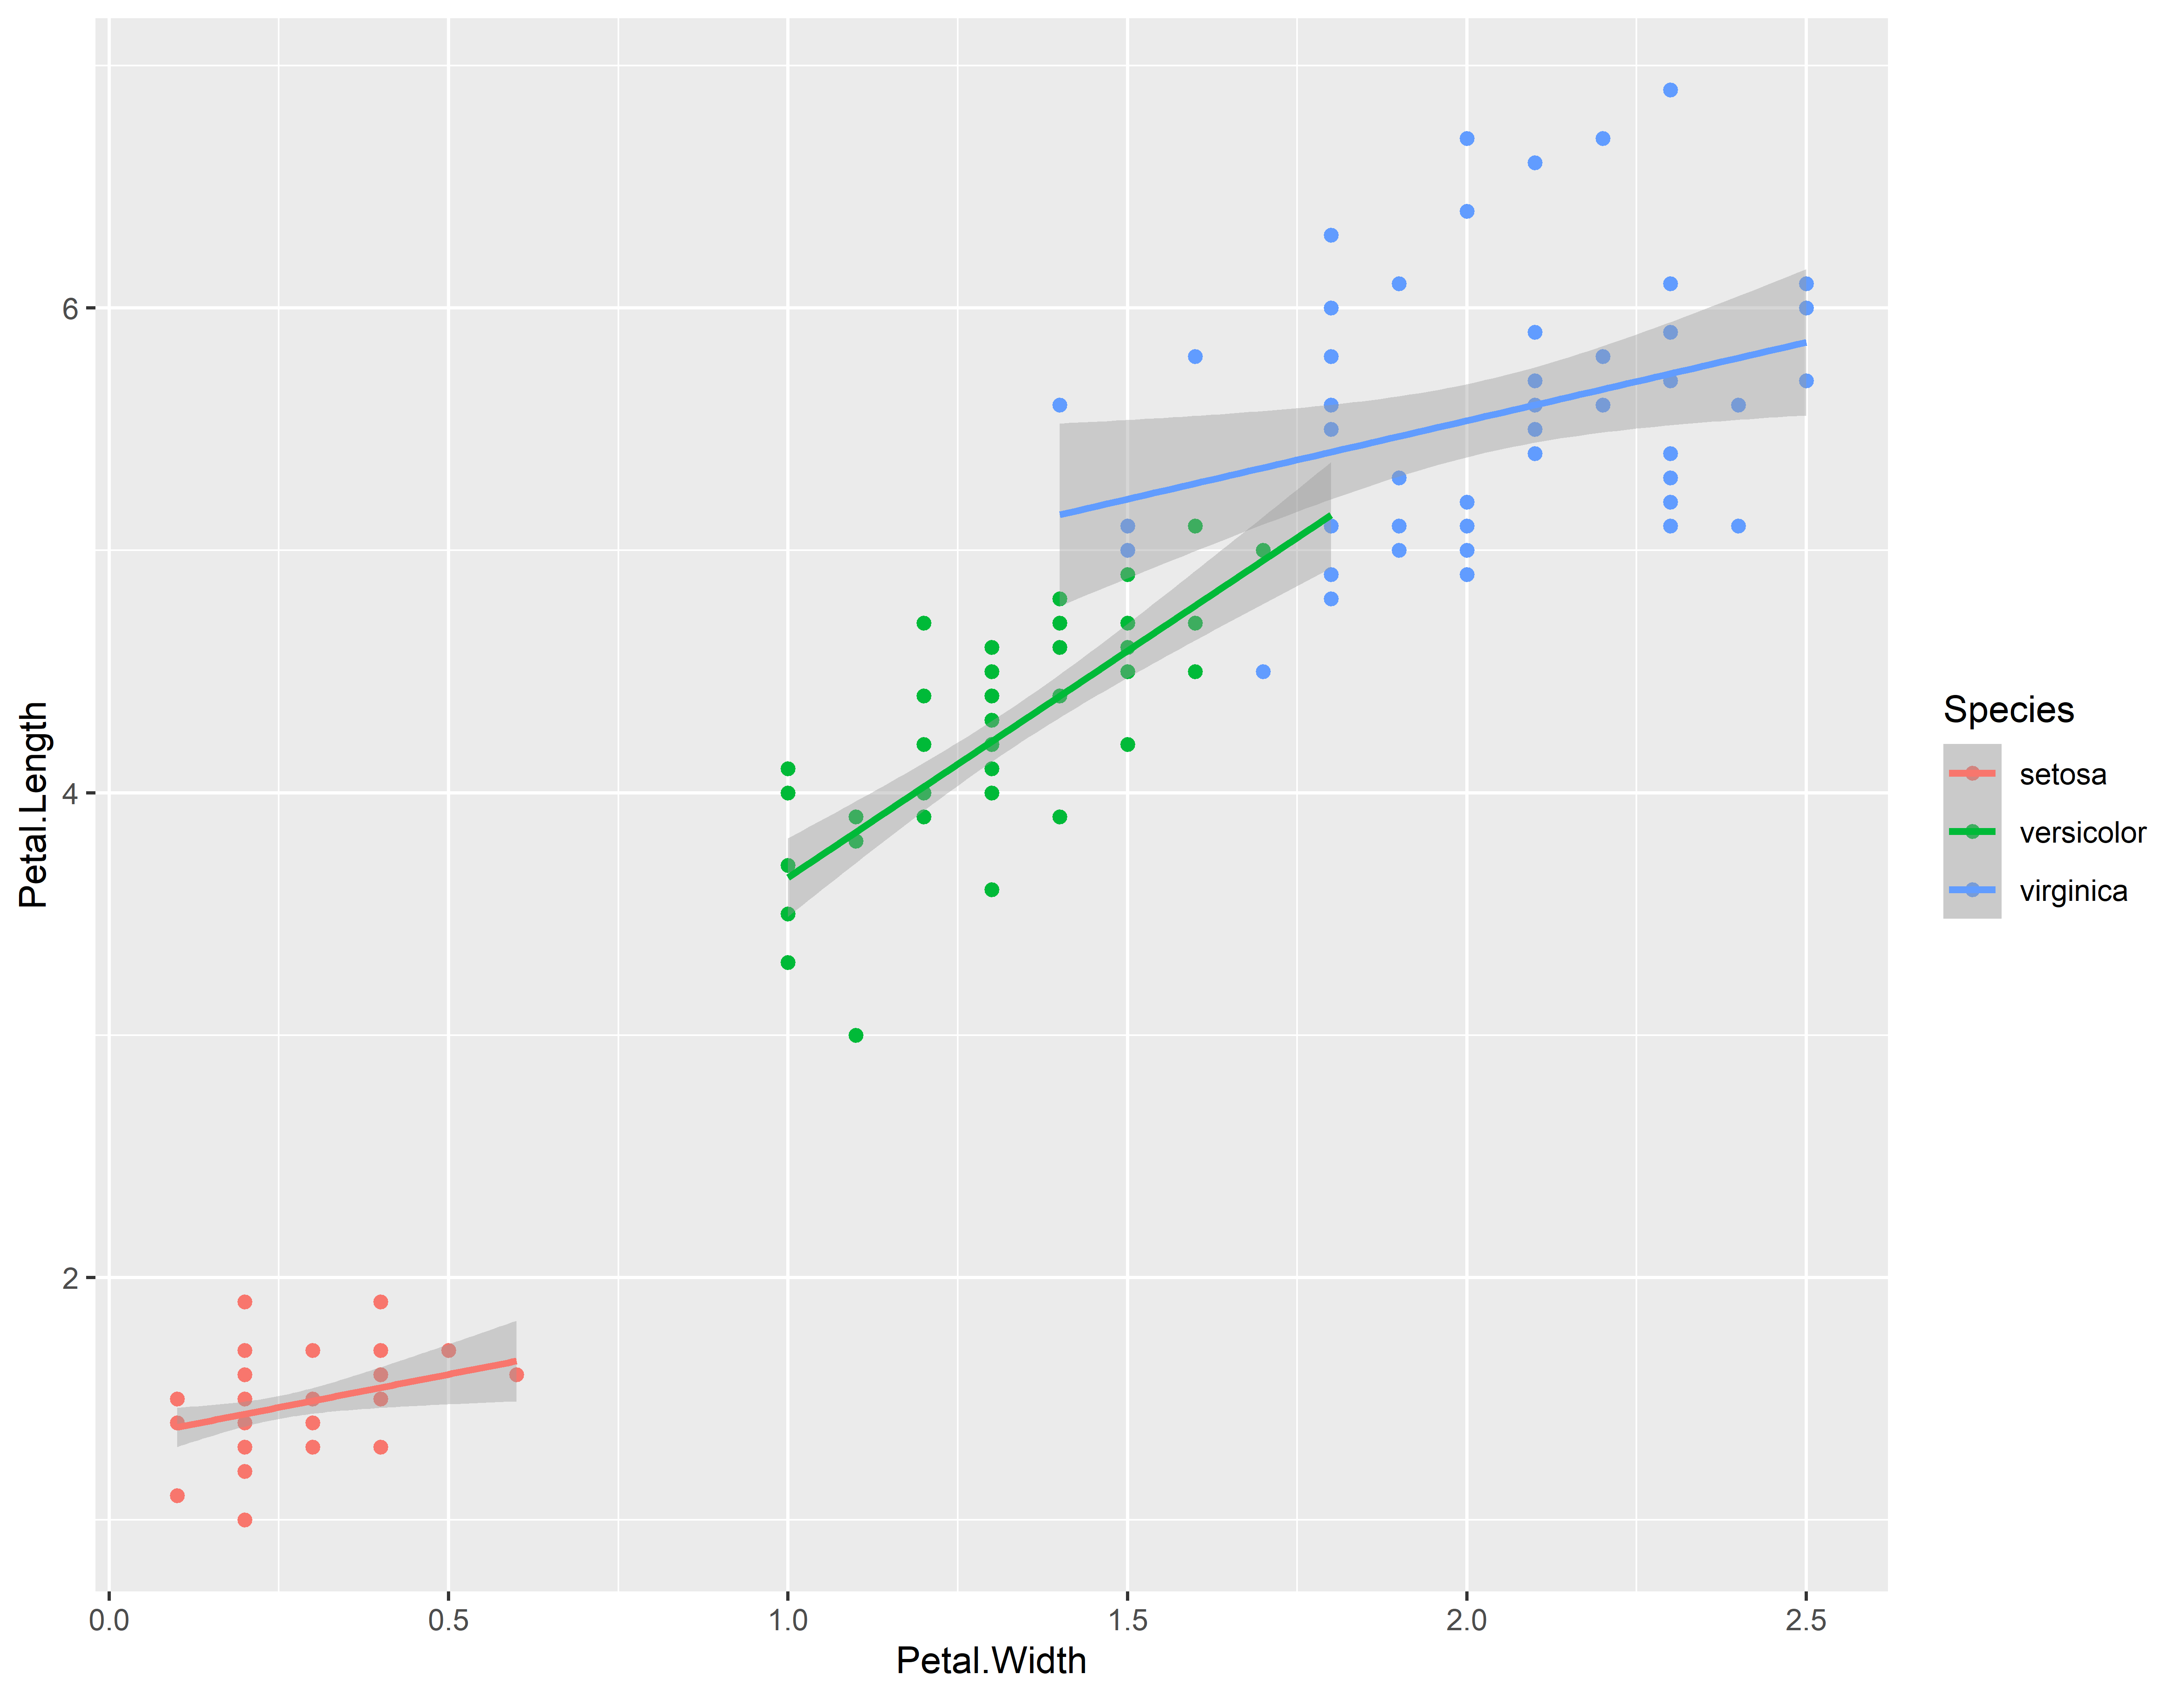
Vamos ver se temos alguma relação entre as variáveis
iris %>%
  group_by(Species) %>%
  ggplot(aes(x=Petal.Width, y=Petal.Length, color=Species)) +
  geom_point() +
  geom_smooth(method = "lm") +
  labs(title = "Relação entre Petal Width e Petal Length",
       x = "Largura (cm)",
       y = "Comprimento (cm)") +
  theme_minimal()
#> `geom_smooth()` using formula = 'y ~ x'
Vamos ver como se distribui o Petal.Width
iris %>%
  group_by(Species) %>%
  ggplot(aes(x=Petal.Width, fill=Species)) +
  geom_histogram(color="Black") +
  theme_minimal()
#> `stat_bin()` using `bins = 30`. Pick better value with `binwidth`.
Vamos ver como se distribui o Petal.Length
iris %>%
  group_by(Species) %>%
  ggplot(aes(x=Petal.Length, fill=Species)) +
  geom_histogram(color="Black") +
  theme_minimal()
#> `stat_bin()` using `bins = 30`. Pick better value with `binwidth`.
