Eixos - Escalas - Cores
Carregando bibliotecas
Filtrando dados e fazendo grafico de dispersão padrão
gap_07 <- filter(gapminder, year == 2007)
ggplot(gap_07, aes(x = gdpPercap, y = lifeExp)) +
  geom_point() +
  theme_light()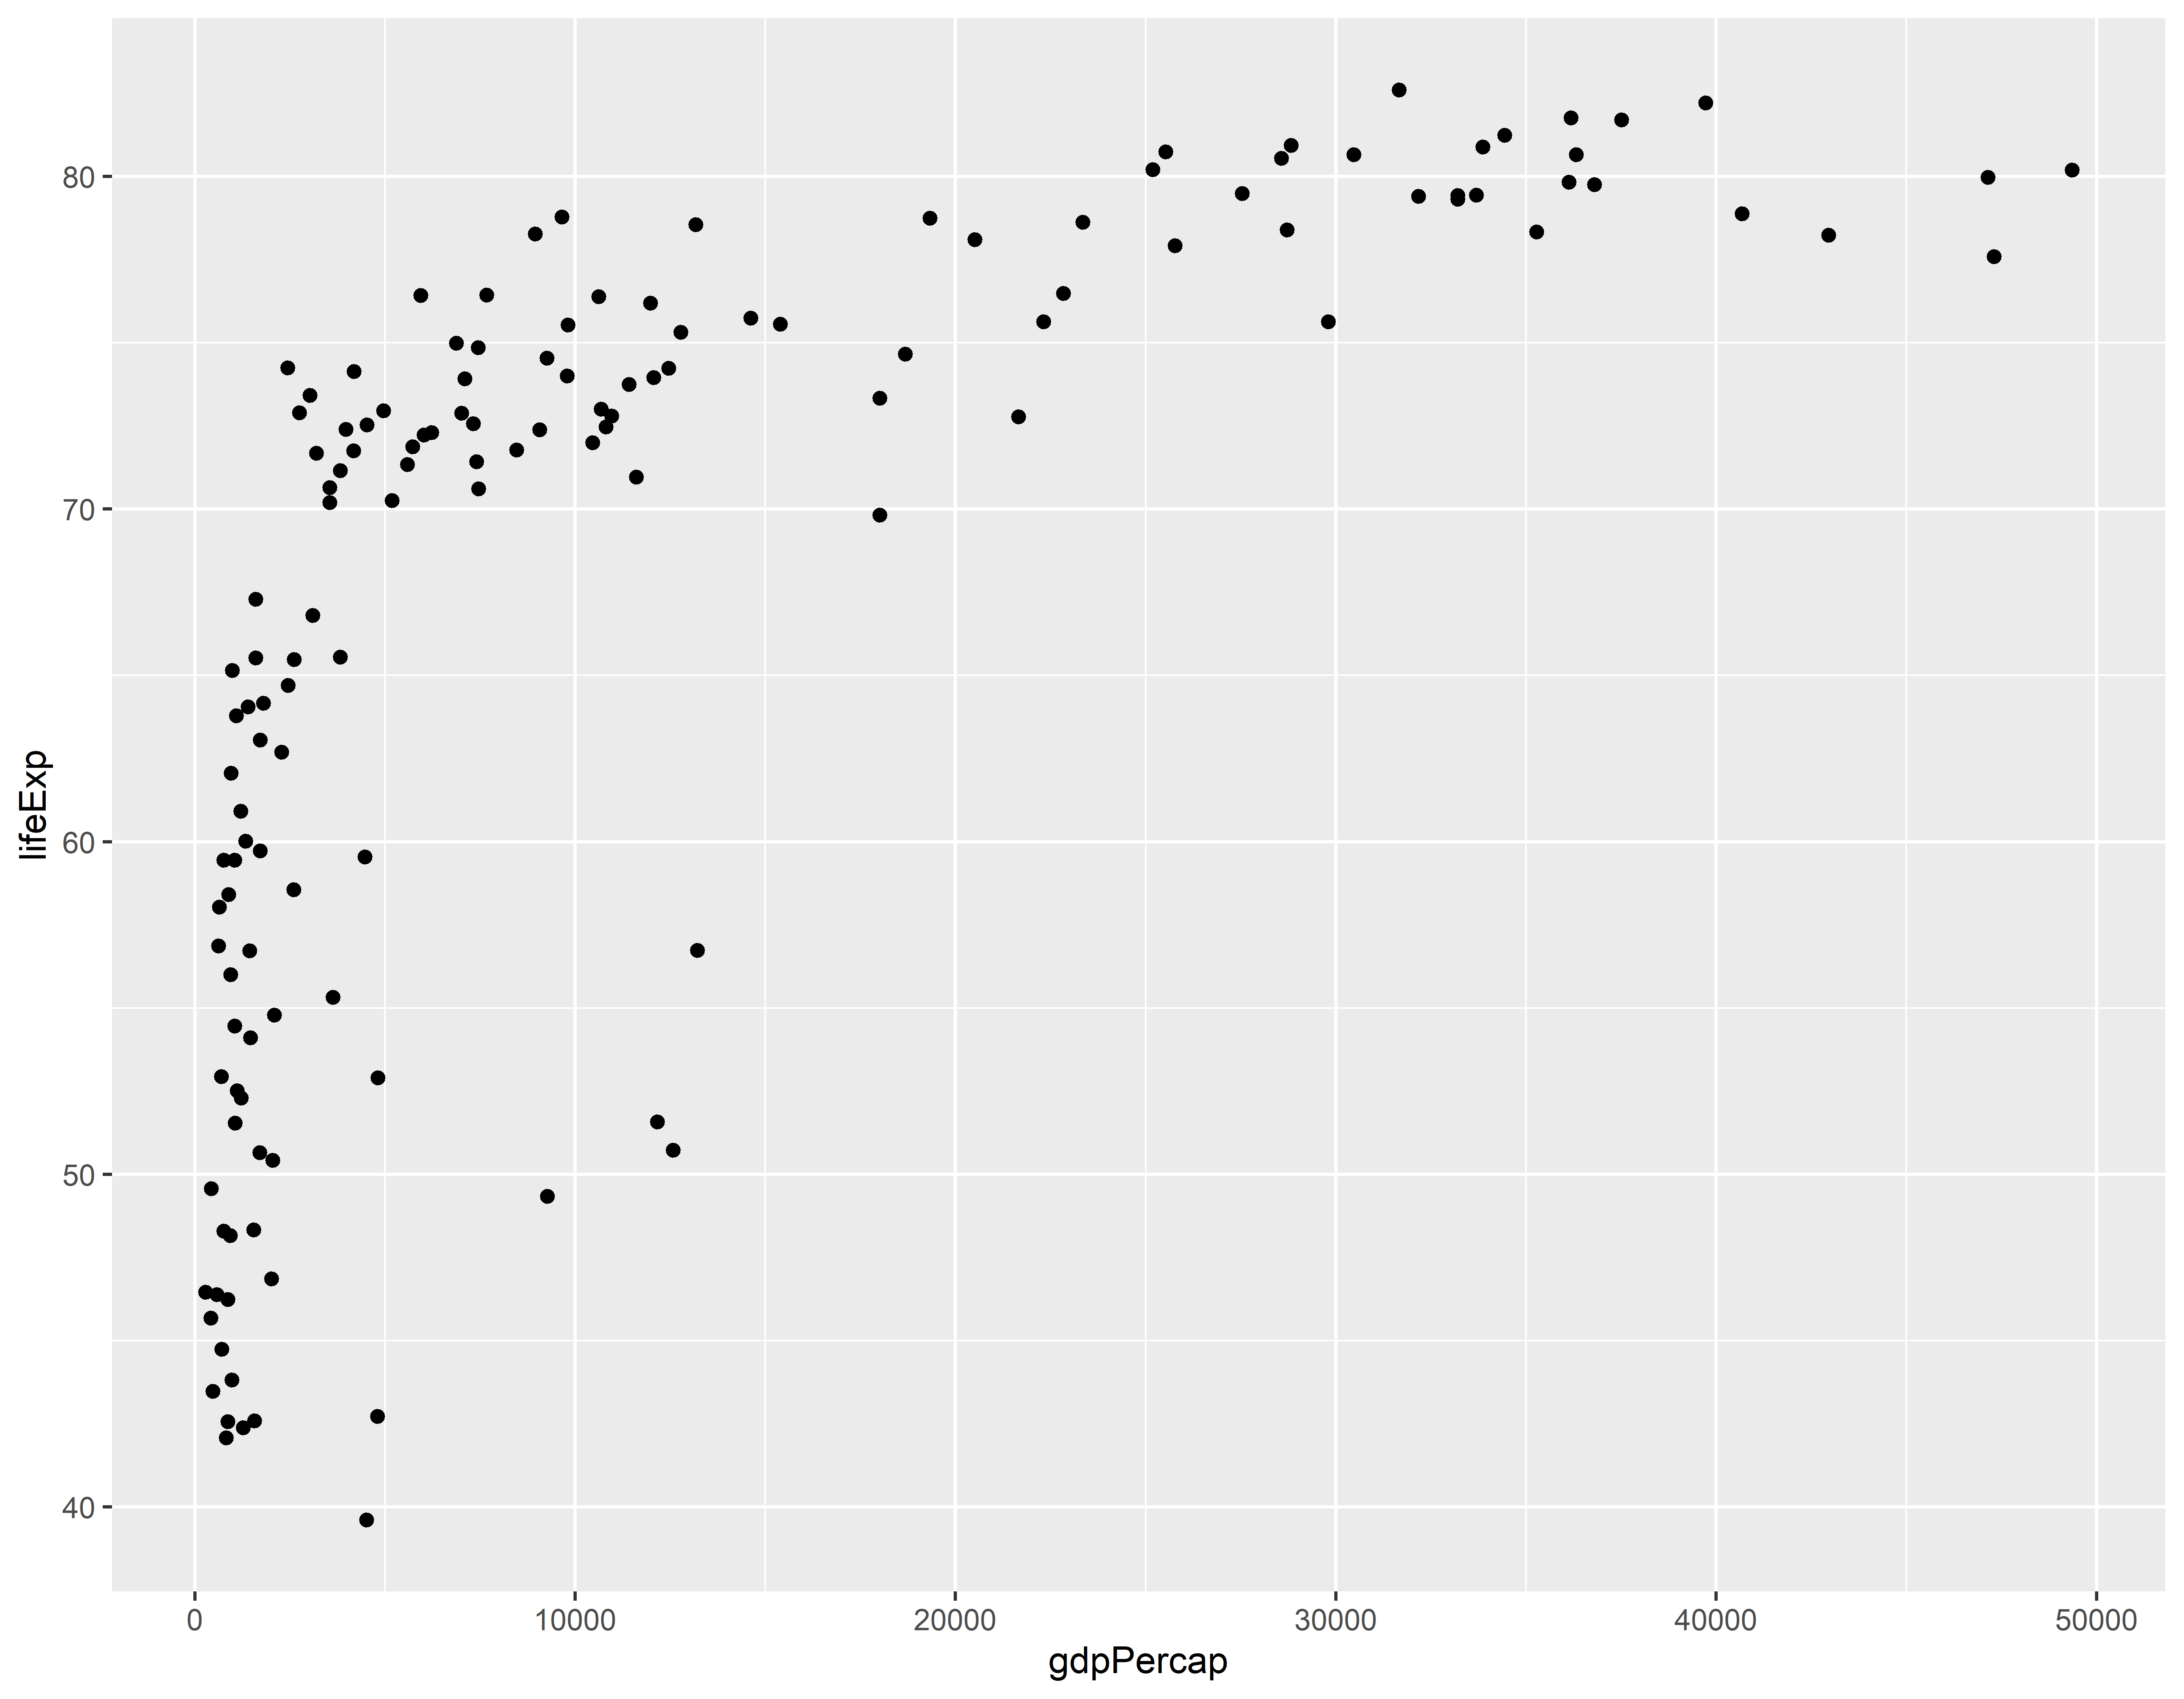
Transformando o eixo x para escala logarítimica
ggplot(gap_07, aes(x = gdpPercap, y = lifeExp)) +
  geom_point() +
  scale_x_continuous(trans = "log10") +
  theme_light()
Outra forma de transformação do eixo x
ggplot(gap_07, aes(x = gdpPercap, y = lifeExp)) +
  geom_point() +
  scale_x_log10() +
  theme_light()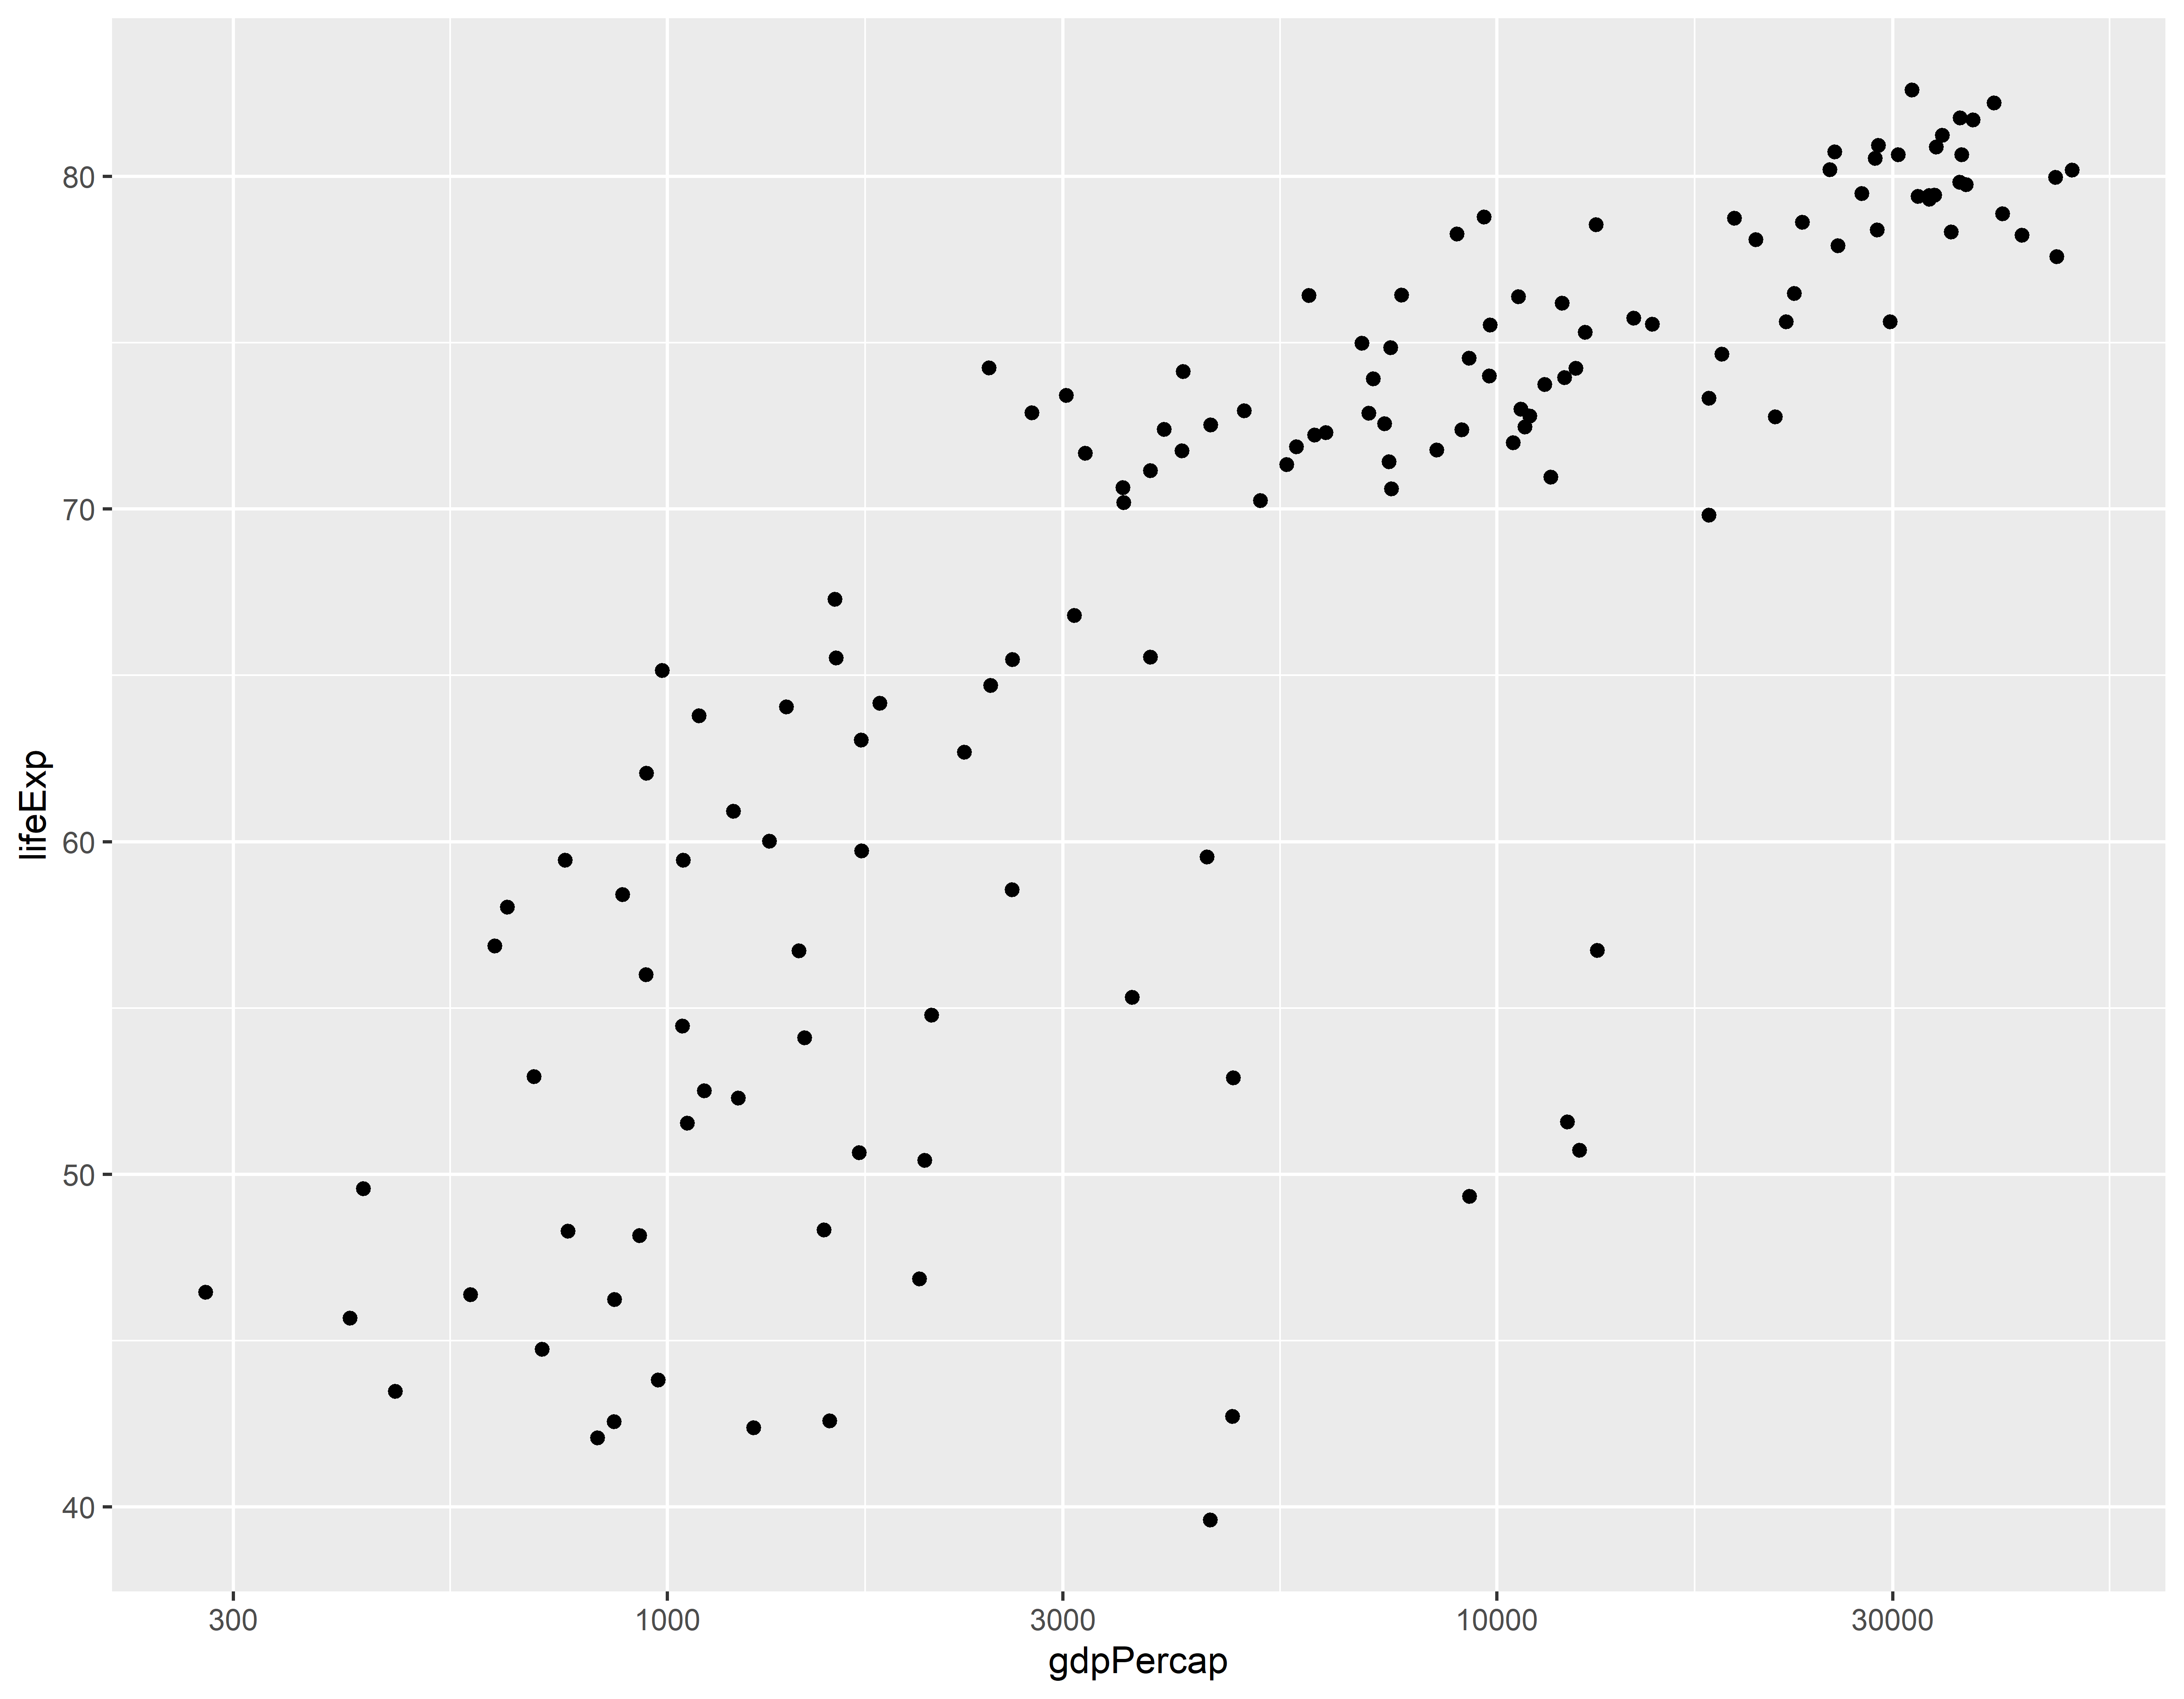
Definindo limites para o eixo y
ggplot(gap_07, aes(x = gdpPercap, y = lifeExp)) +
  geom_point() +
  scale_x_log10() +
  scale_y_continuous(limits = c(0, 95)) +
  theme_light()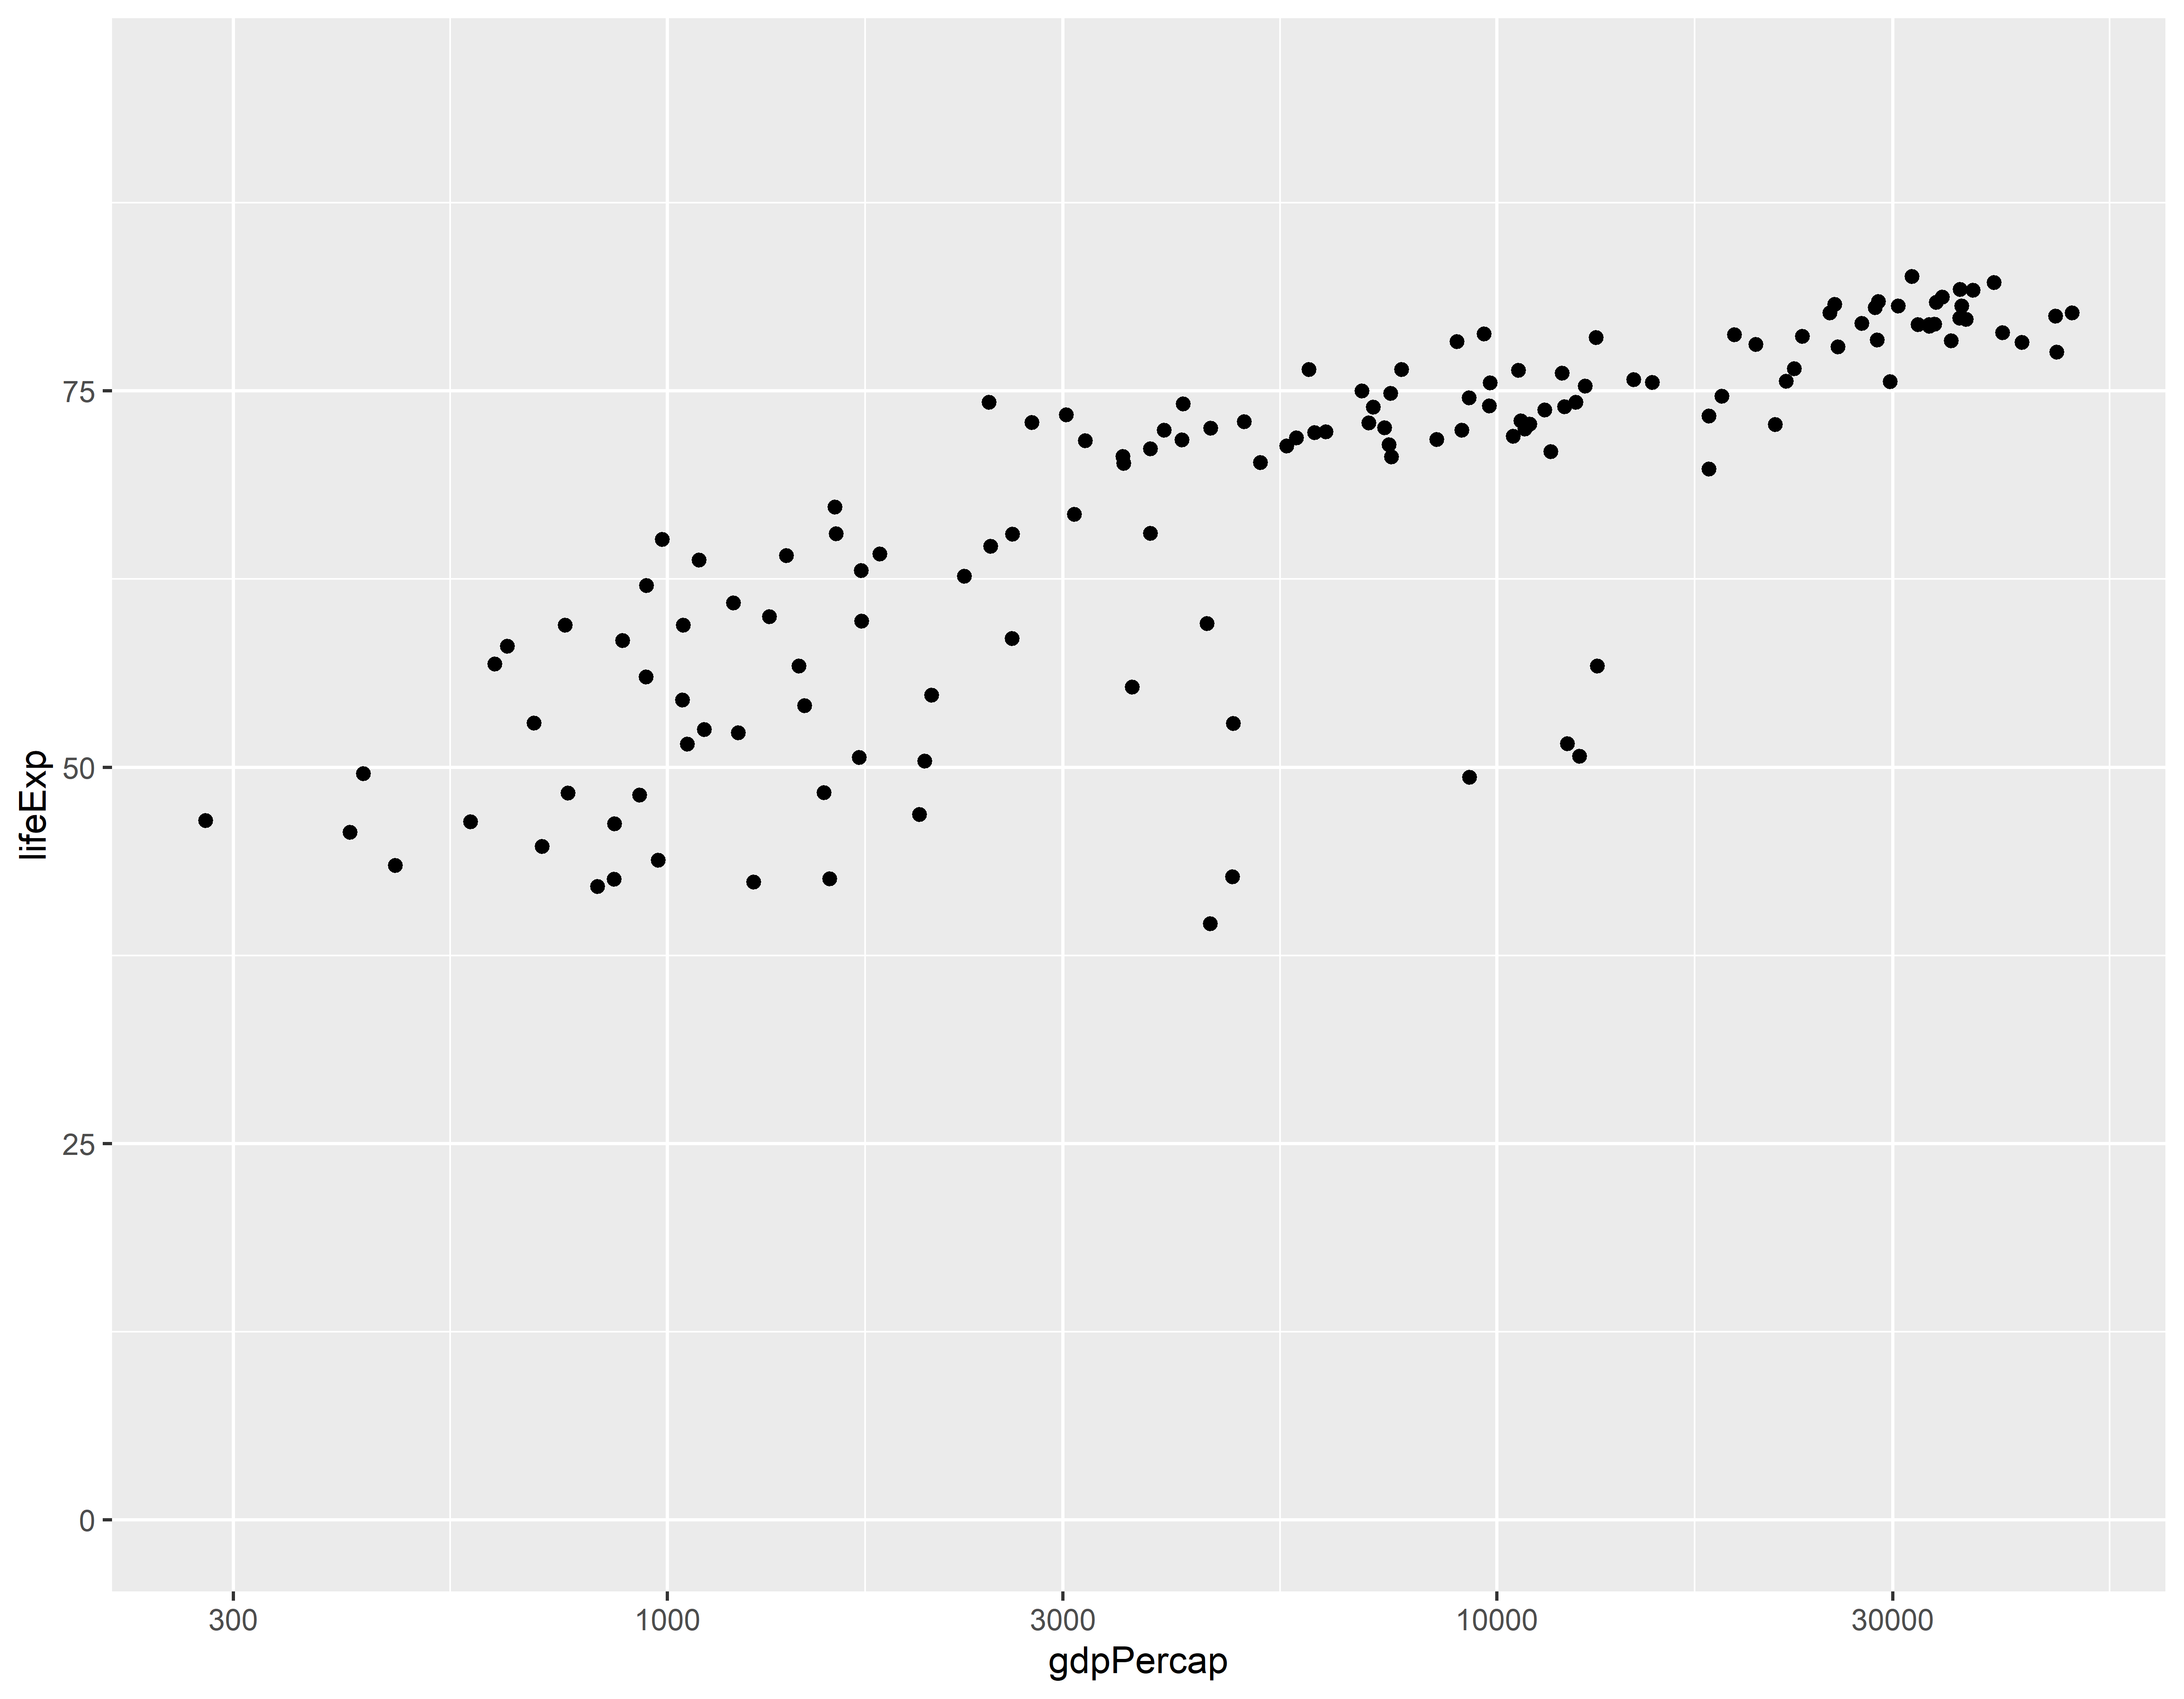
Grafico com cores normais
ggplot(gap_07, aes(x = gdpPercap, y = lifeExp, color = continent)) +
  geom_point() +
  scale_x_log10() +
  theme_light()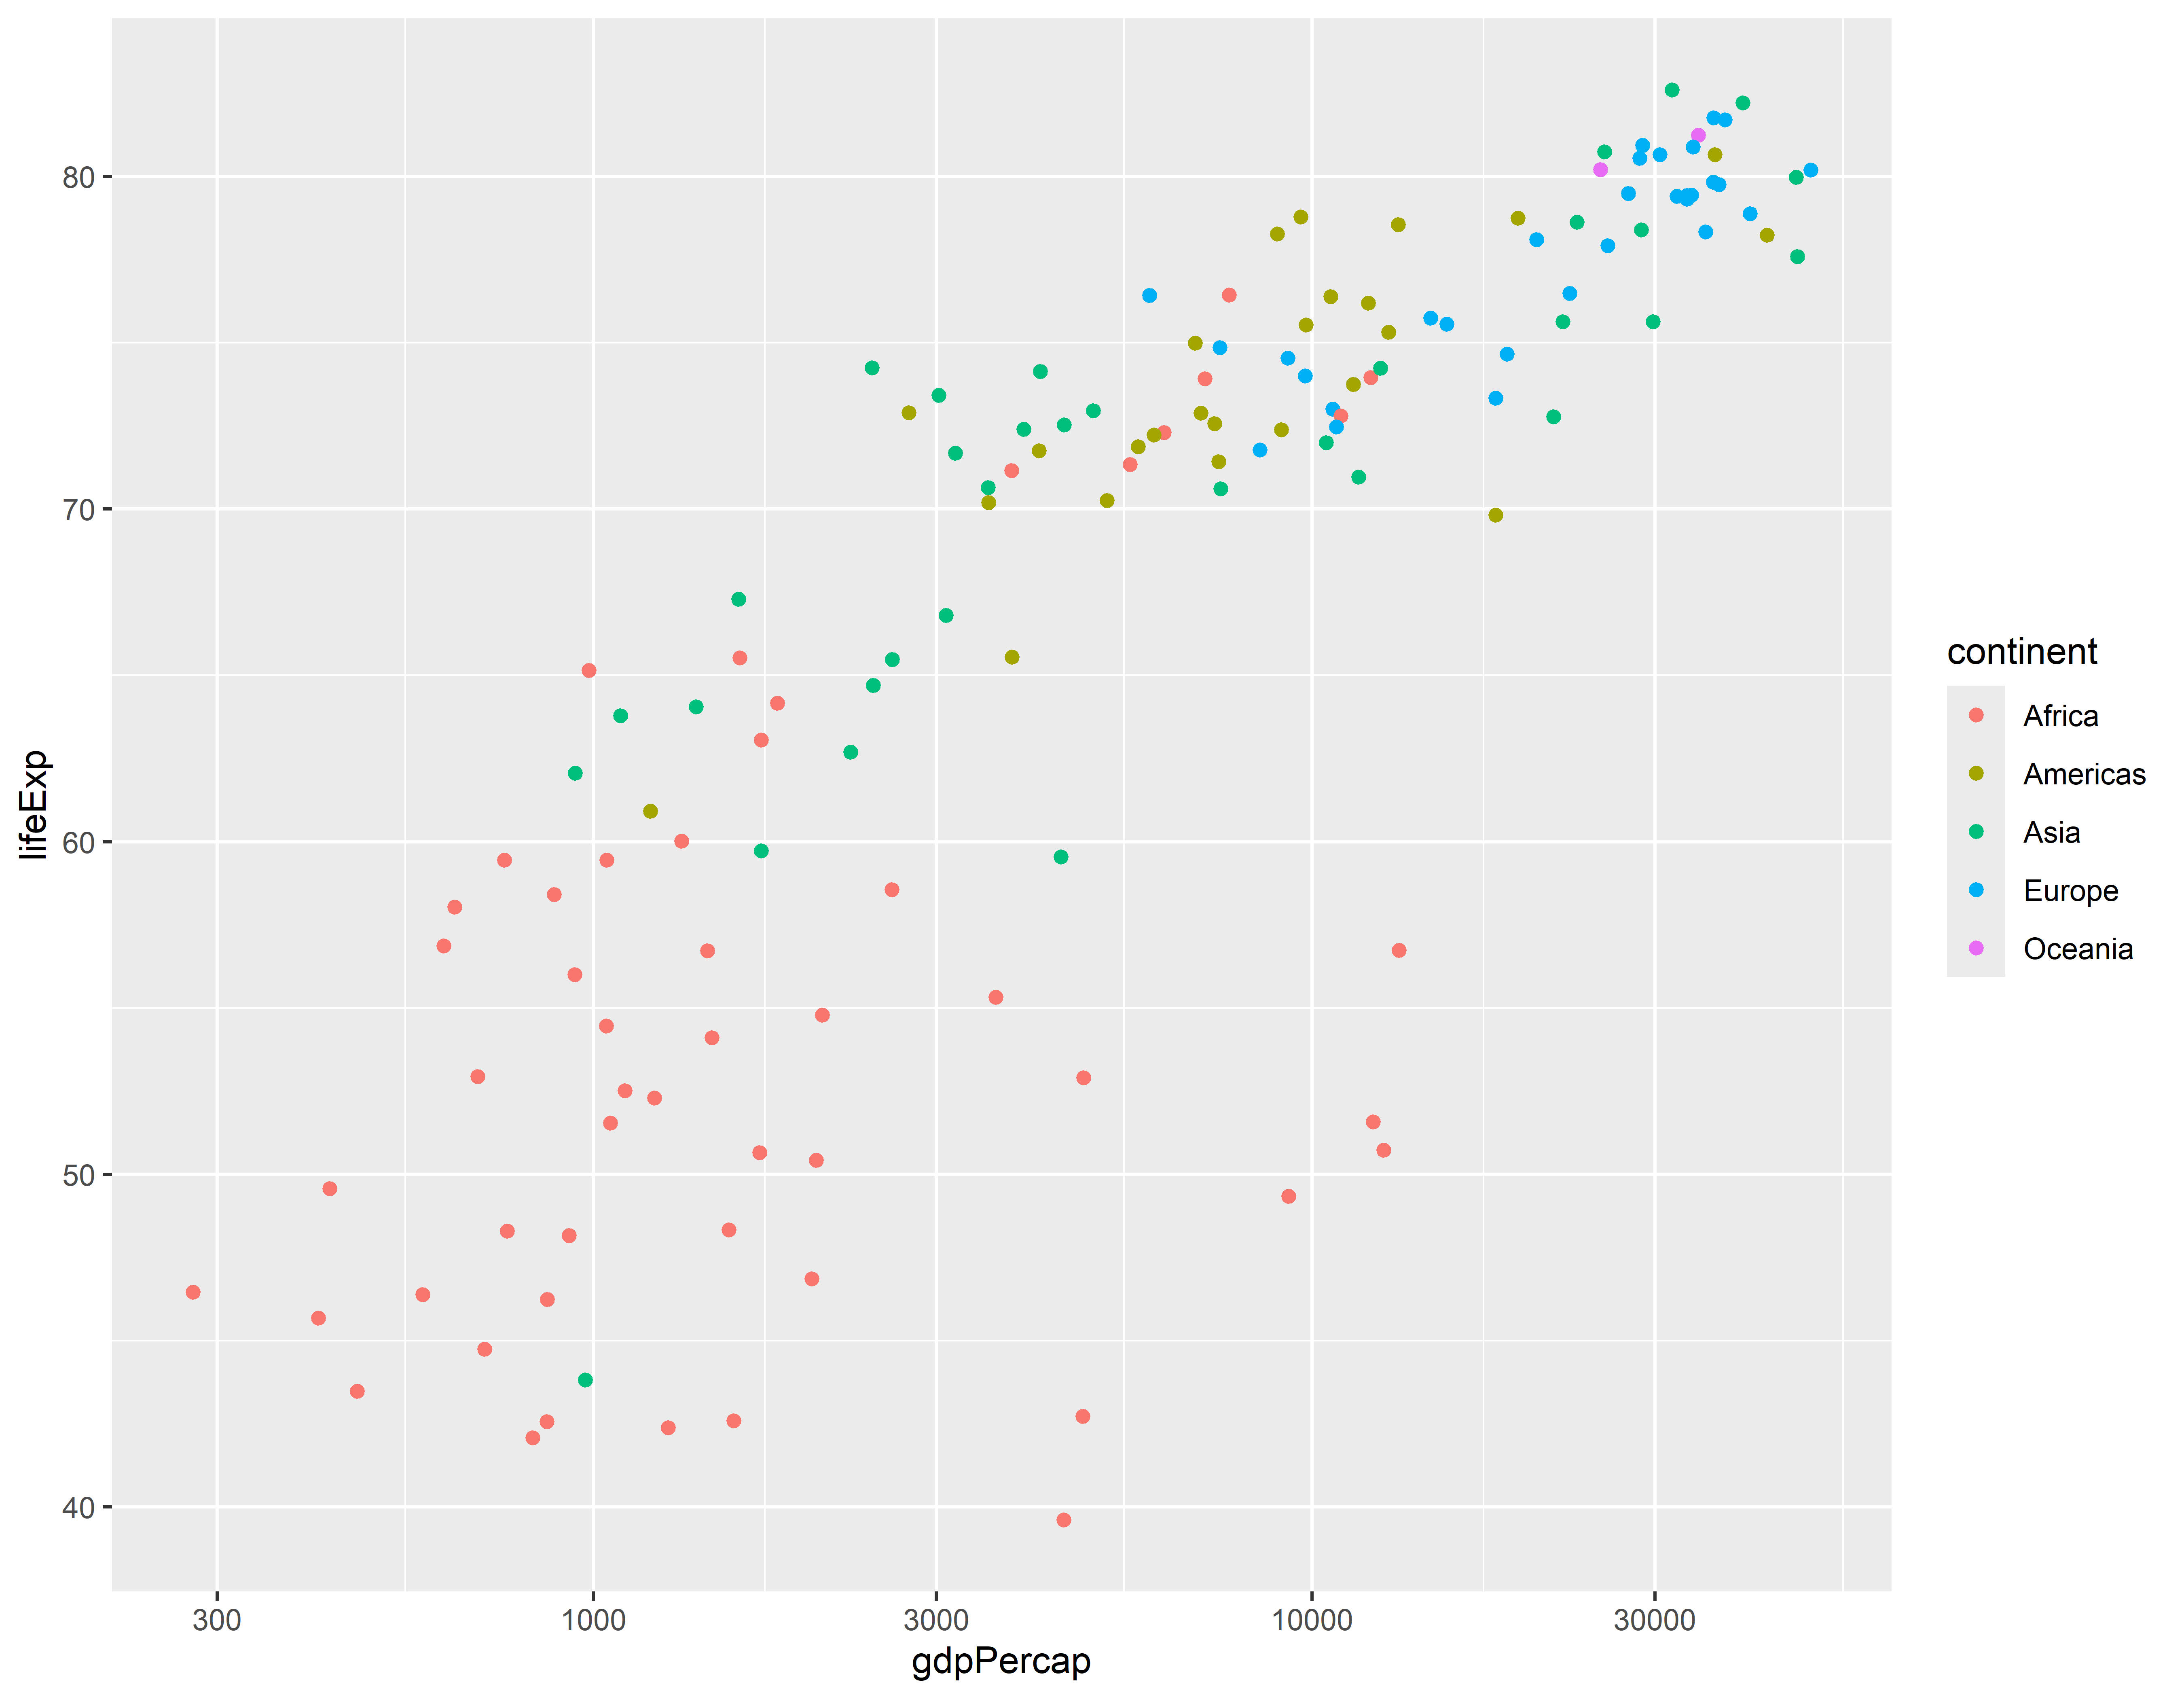
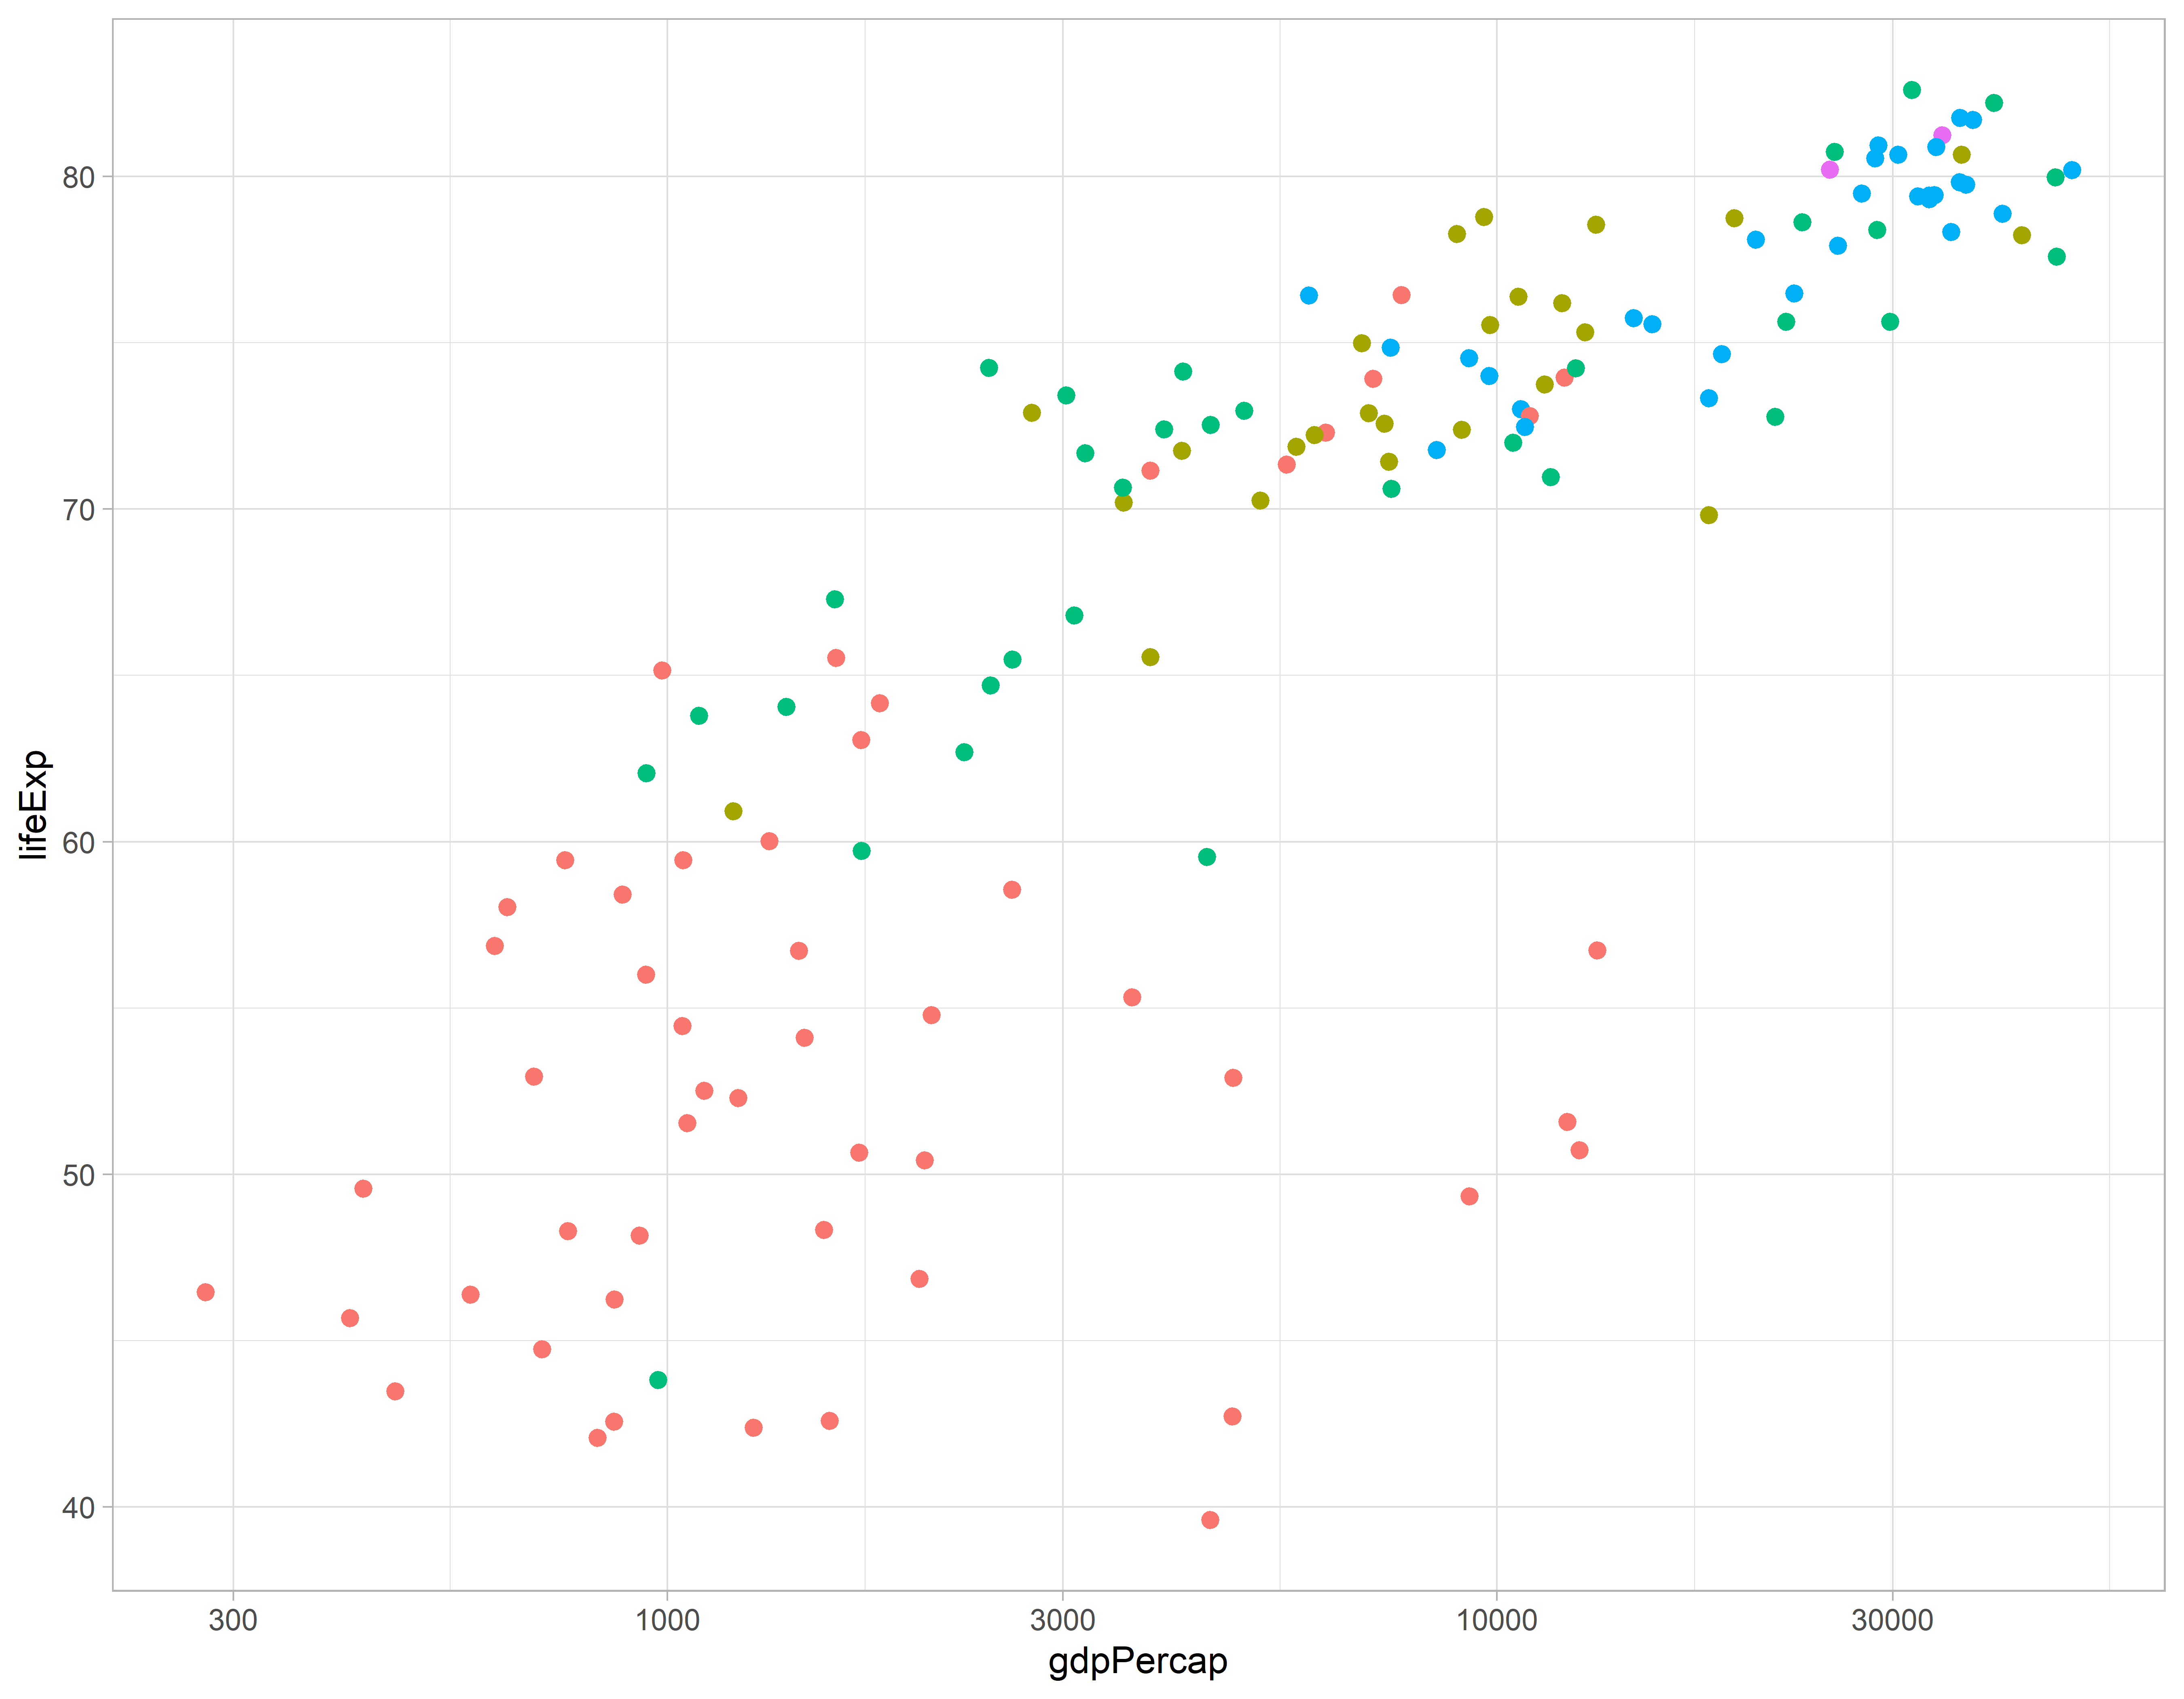
Grafico usando uma paleta de cores diferente
ggplot(gap_07, aes(x = gdpPercap, y = lifeExp, color = continent)) +
  geom_point() +
  scale_x_log10() +
  scale_color_brewer(palette = "Dark2") +
  theme_light()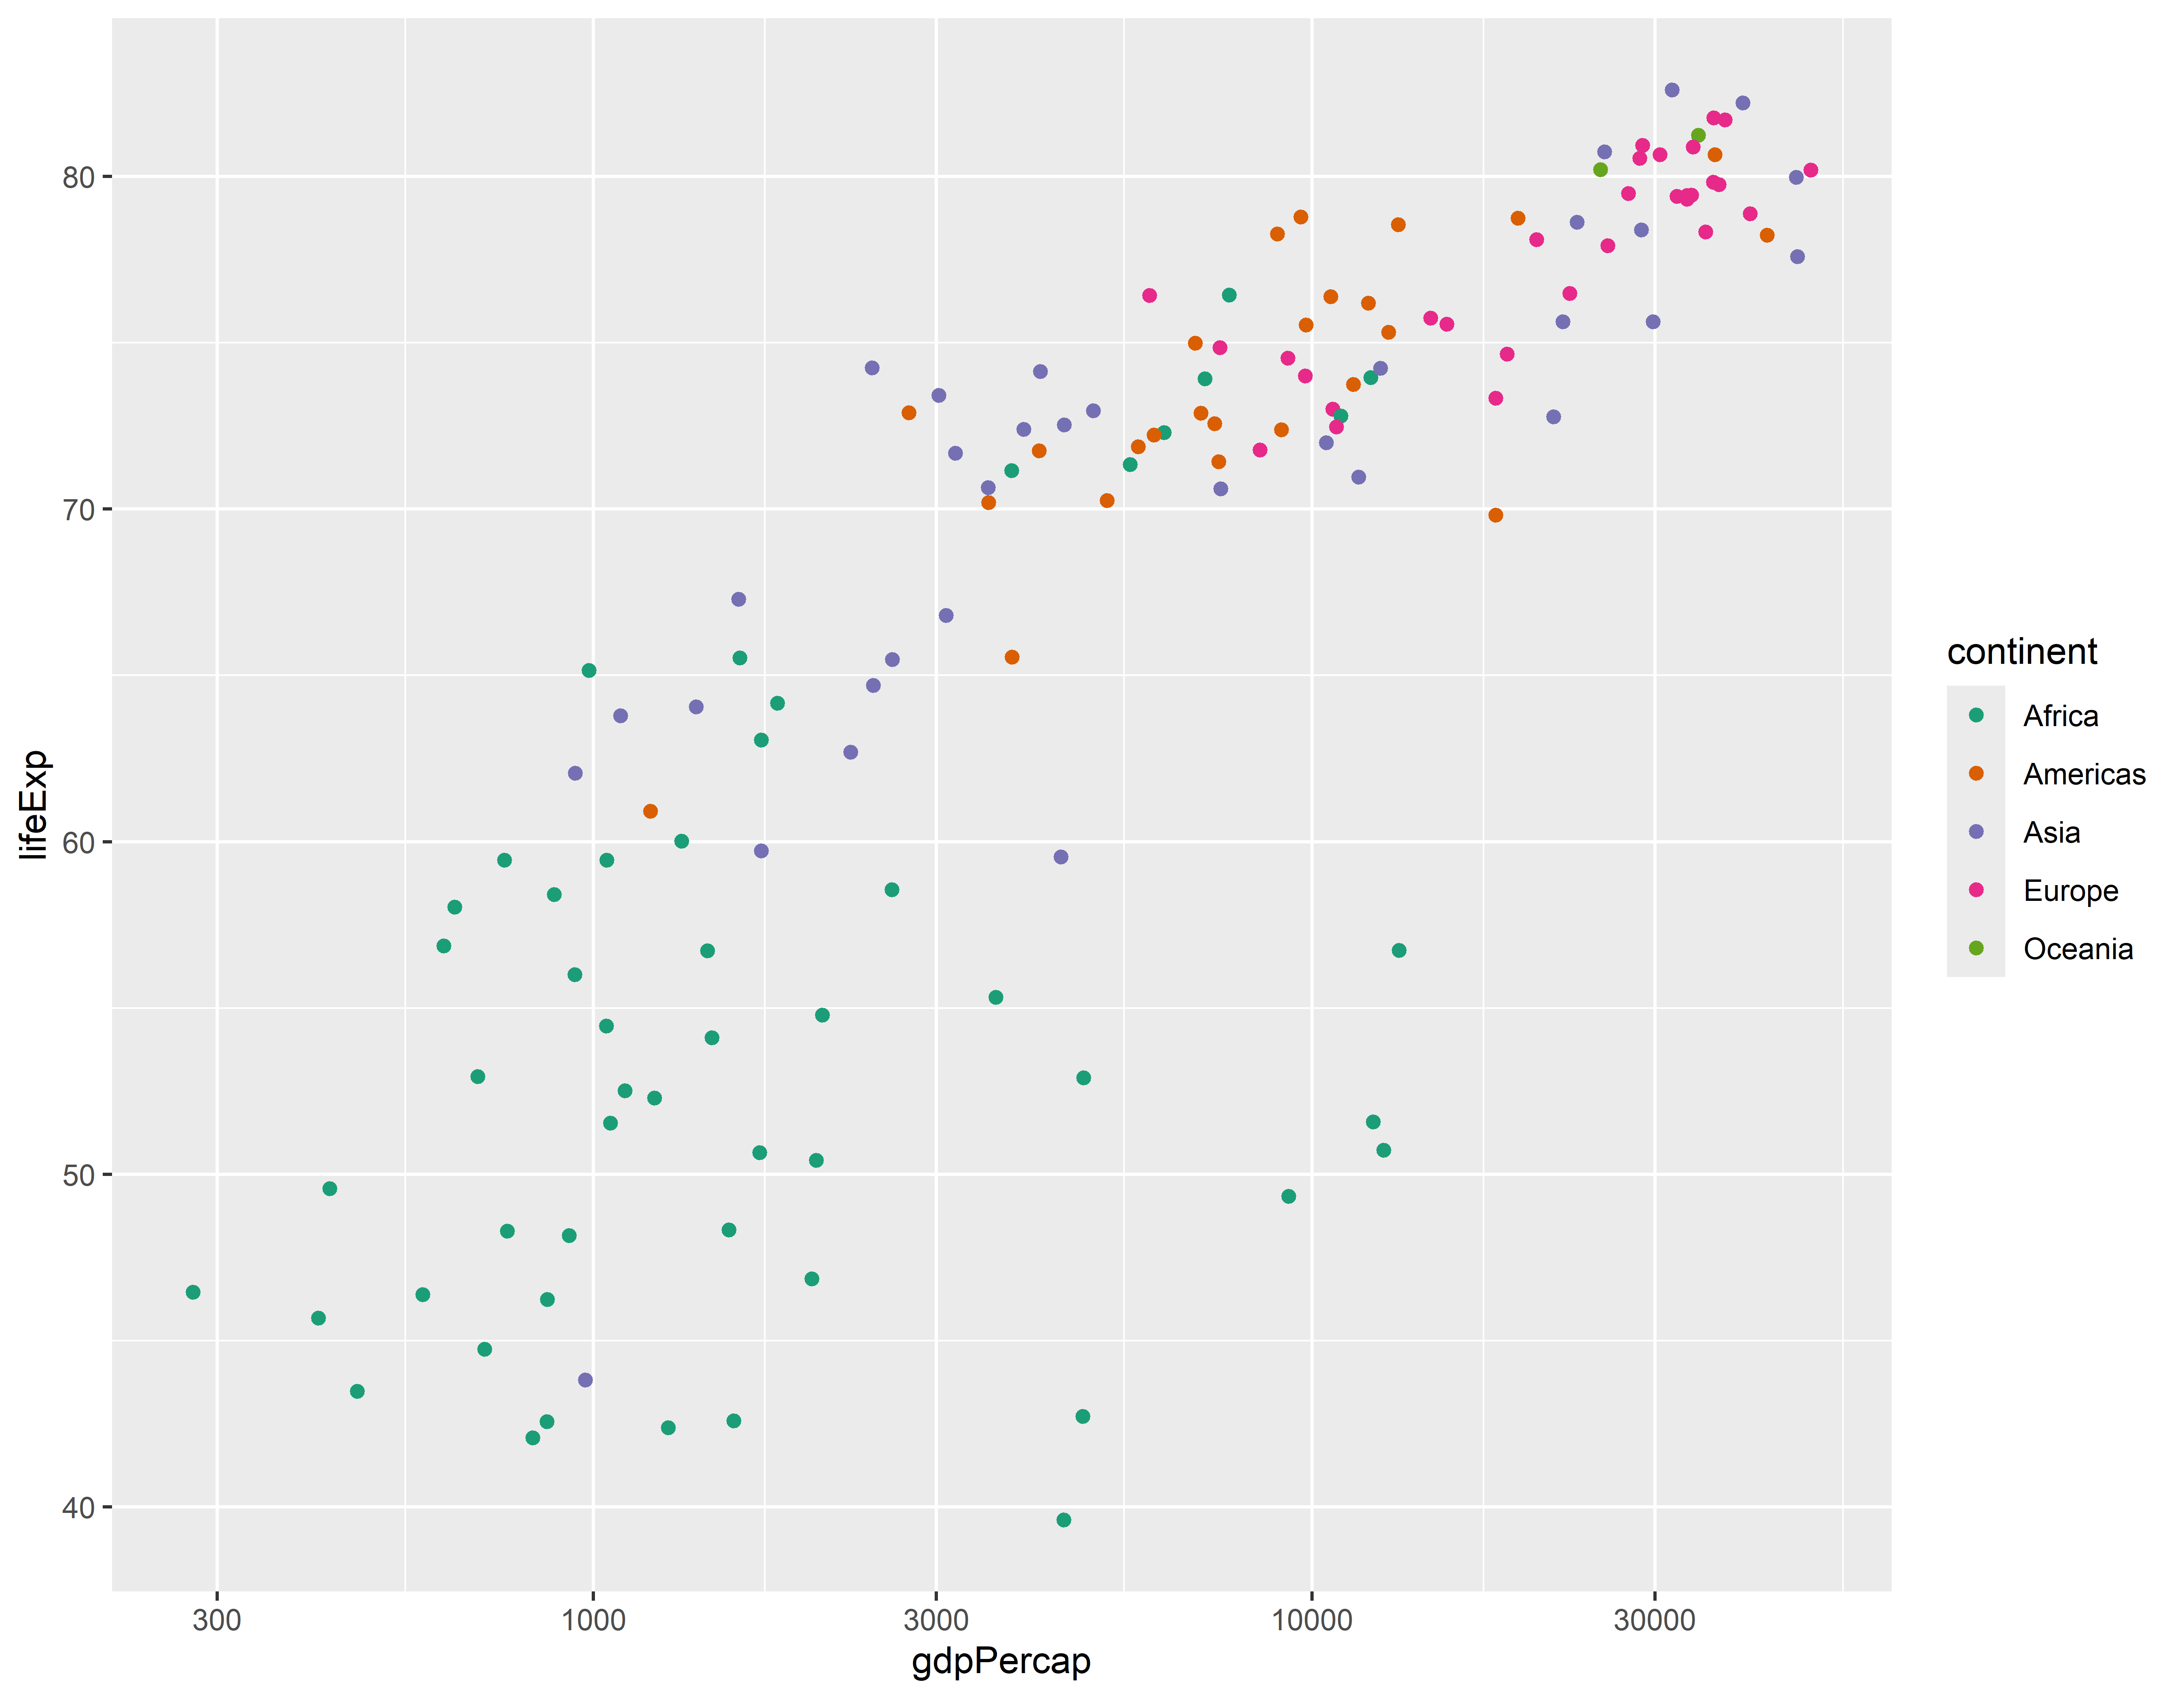
Usando codigos manuais para as cores
ggplot(gap_07, aes(x = gdpPercap, y = lifeExp, color = continent)) +
  geom_point() +
  scale_x_log10() +
  scale_color_manual(values = c("#FF0000", "#00A08A", "#F2AD00",
                                "#F98400", "#5BBCD6")) +
  theme_light()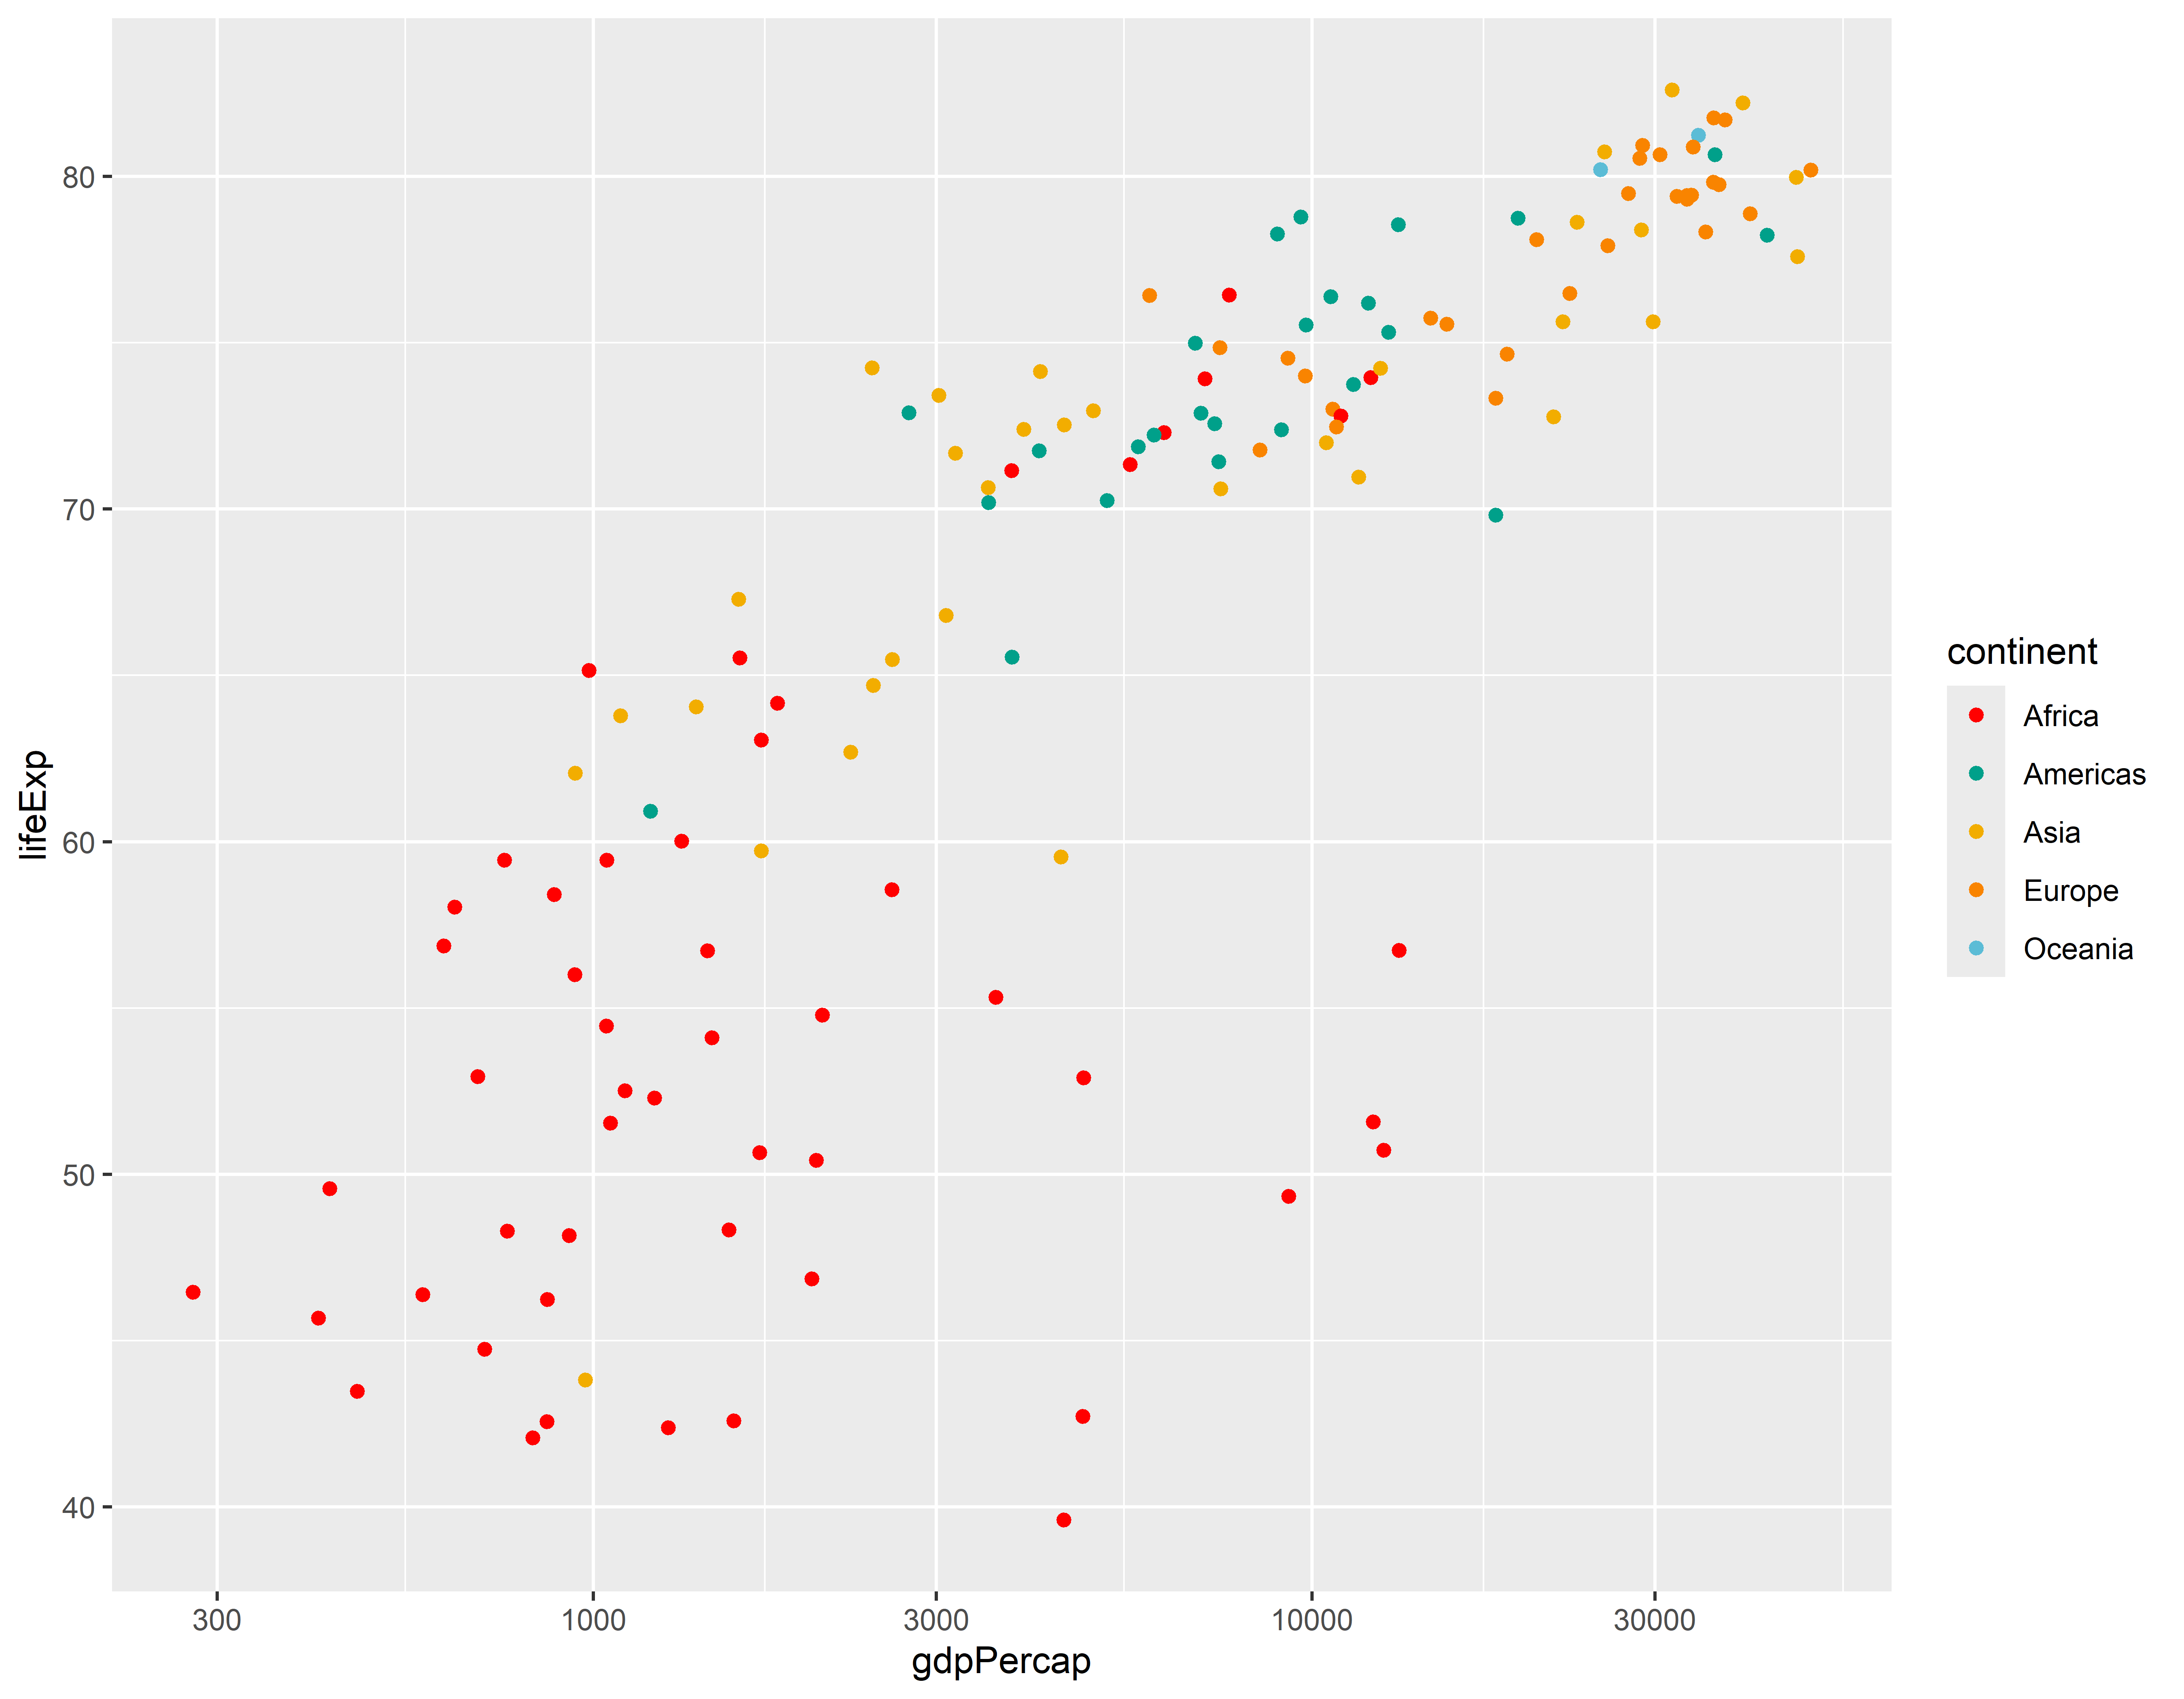
Definindo as cores e tamanho dos pontos
ggplot(gap_07, aes(x = gdpPercap, y = lifeExp)) +
  geom_point(color = "darkblue", size = 3) +
  scale_x_log10() +
  theme_light()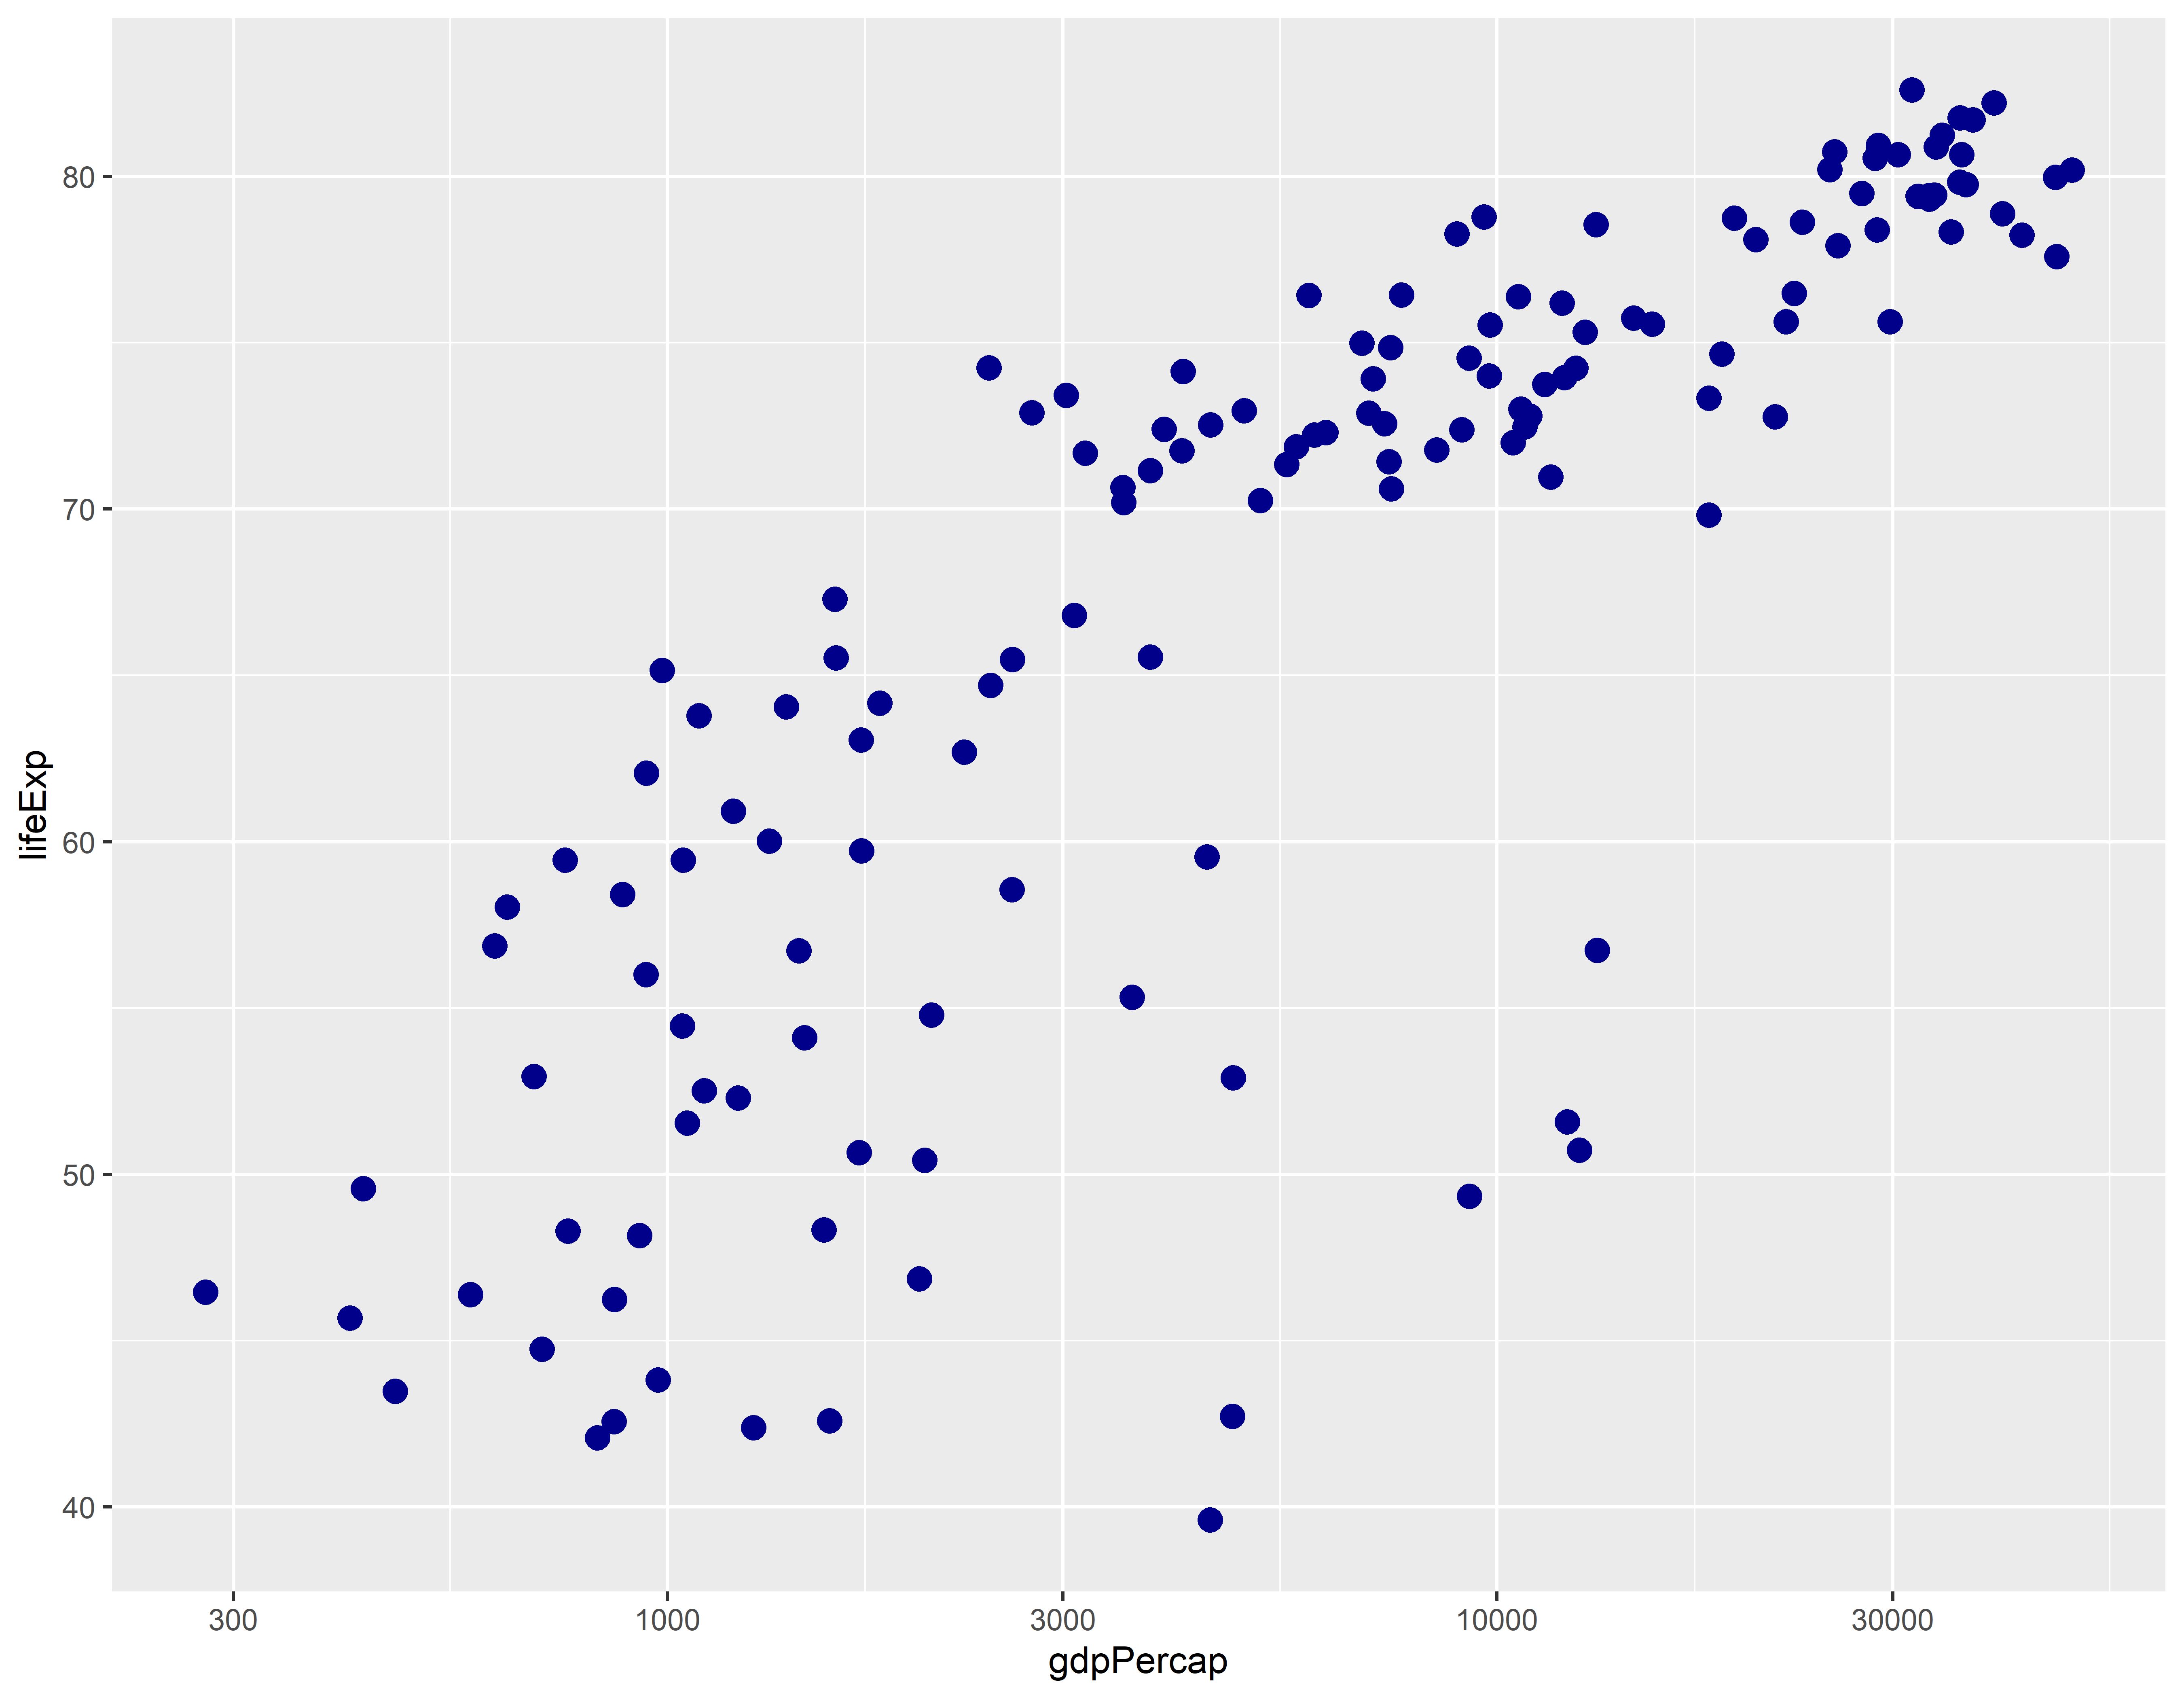
Customizando títulos, rótulos de eixo e legendas
ggplot(gap_07, aes(x = gdpPercap, y = lifeExp, color = continent)) +
  geom_point(size = 2) +
  scale_x_log10() +
  theme_light() +
  theme(legend.position = "bottom")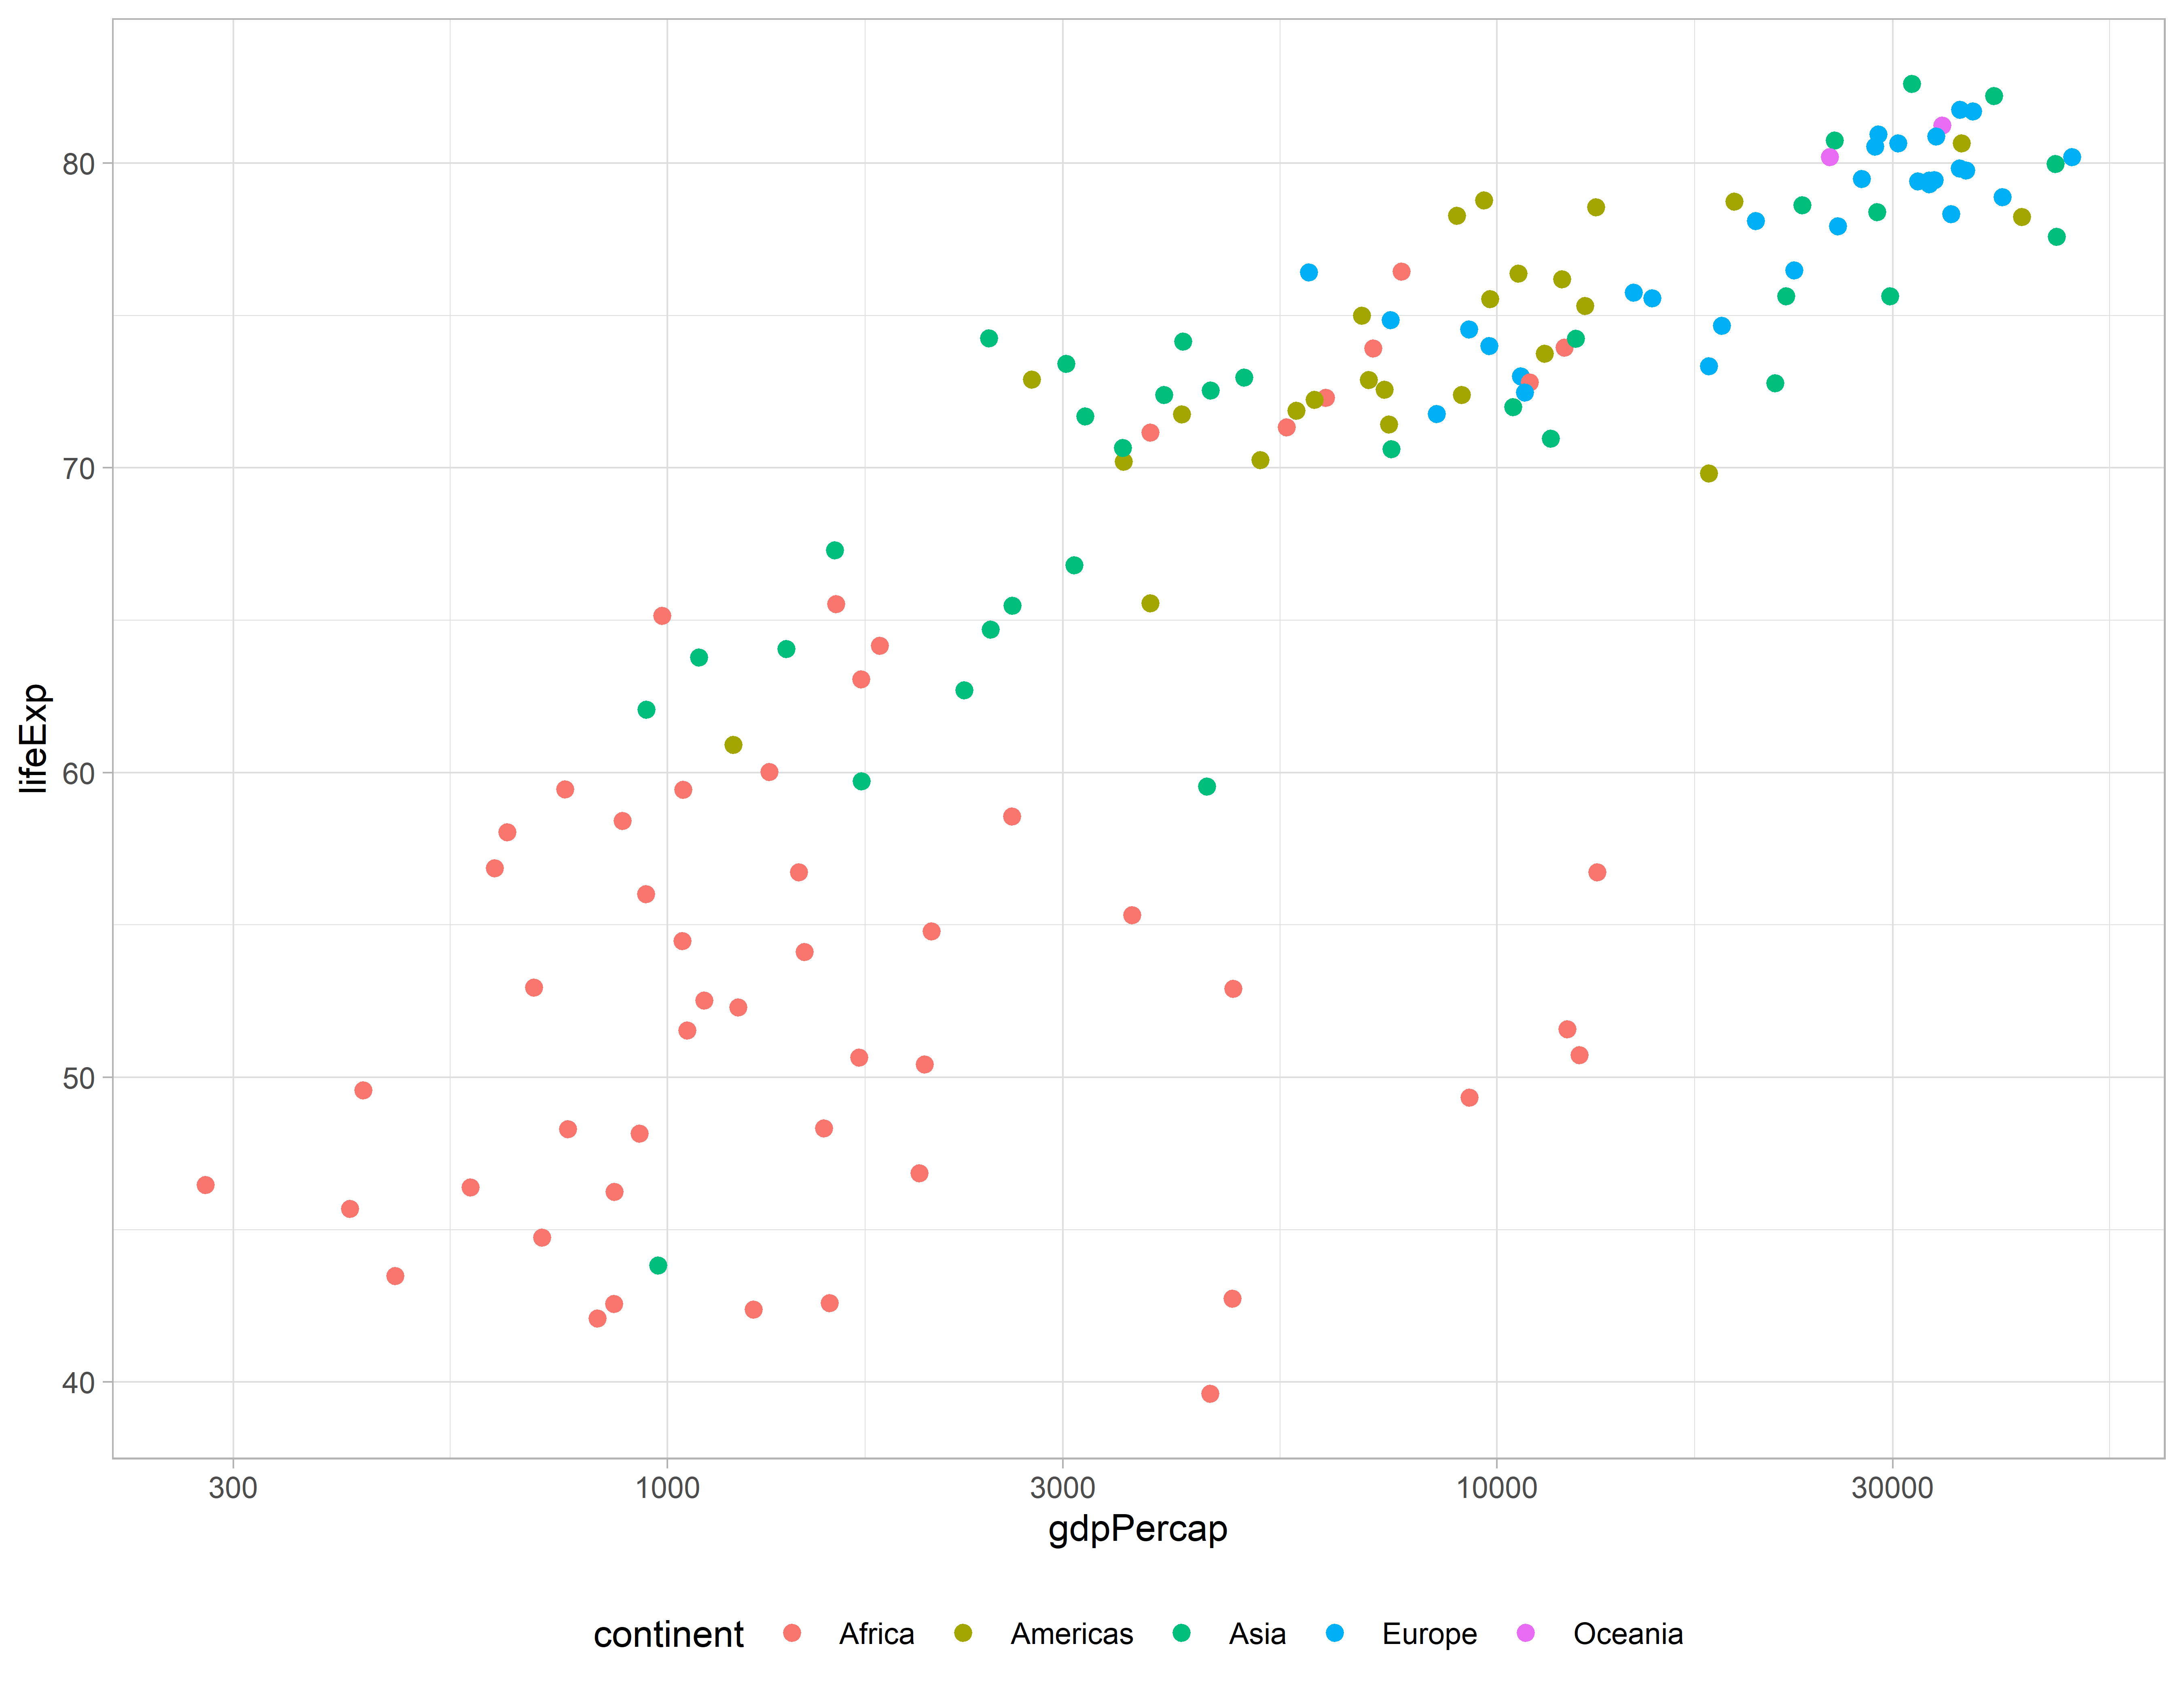
Sem legenda
ggplot(gap_07, aes(x = gdpPercap, y = lifeExp, color = continent)) +
  geom_point(size = 2) +
  scale_x_log10() +
  theme_light() +
  theme(legend.position = "none")